


Japanese Yen Intervention: Volatility Fades, But Turning Points Emerge
USD/JPY plunged nearly 500 pips as suspected MOF intervention hit the market. While volatility typically fades after the initial shock, history shows these events often coincide with major turning points.
Share this:

Traders cannot say Thursday’s surge in the Japanese yen came without warning. Japan’s top FX diplomat had already issued what he called a “final warning” just hours earlier. The near 500-pip drop in USD/JPY certainly fits the profile of a classic intervention by the Ministry of Finance Japan—although, as is typical, official confirmation has yet to come.
Naturally, this has traders on edge for a potential second wave of volatility. But officials would likely need to be provoked again for moves of that magnitude to repeat. Besides, history suggests volatility tends to diminish after the initial intervention.
When you watch charts all day, you develop a feel for how volatility behaves around major events. Still, it pays to run the numbers—and in this case, they back it up.
View related analysis:
View related analysis:
Japanese Yen Intervention: Volatility Patterns and Market Impact
Volatility in the Japanese yen peaks on the day of intervention, then fades in the sessions that follow. The sample size may be small and well below the textbook 30, but the pattern is clear: an initial spike in volatility followed by compression and choppier trade.
- USD/JPY averages a -1.2% decline on intervention day (median -1.45%)
- The average daily range expands to ~3.1% (median 3.33%)
- There is no strong directional bias from T+1 to T+6, reinforcing the idea of consolidation rather than trend
- Daily ranges steadily contract after T+0

Source: LSEG
This isn’t unique to intervention. You see similar behaviour after most market shocks: volatility explodes on impact, then fades as traders regroup and reassess positioning. However, just because volatility diminishes does not mean there is no impact, as intervention usually preceded turning points on USD/JPY.


USD/JPY Technical Analysis: US Dollar vs Japanese Yen
Intervention and Turning Points on USD/JPY
Zooming out, intervention tends to coincide with meaningful turning points, regardless of the underlying fundamentals. Of the four major interventions between 2022 and 2024, three aligned with significant reversals. The remaining case saw USD/JPY rebound after an initial ~850-pip drop, but even then it took around two months to break above the prior intervention high—ultimately triggering another intervention and a broader -13.7% downtrend of over 2,200 pips.

Source: ICE, TradingView
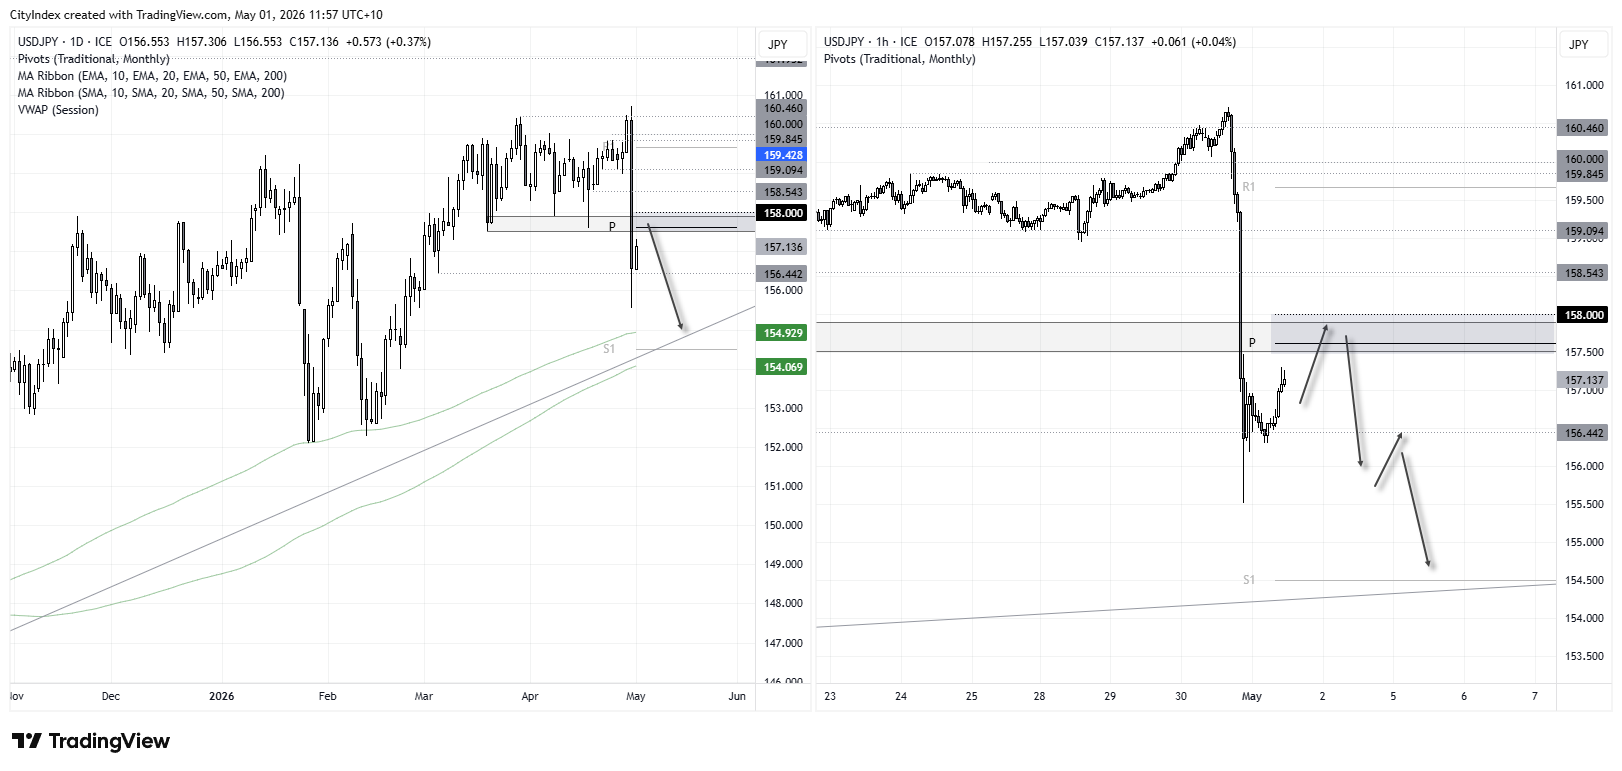
USD/JPY Short-Term Outlook: Bearish Bias Below 158
The daily chart shows a clear bearish engulfing candle, with prices retracing from the lows during today’s Asian session. But with the monthly pivot, range lows and the 158 handle nearby as potential resistance, it almost invites bears to fade into strength.
The 1-hour chart shows momentum pushing higher into that zone, but unless traders are keen to goad the MOF into further action, my bias is for a swing high to form just below—or around—the 158 area.
Note the 200-day averages and long term bullish trendline that could become bearish targets, should momentum roll over once more.
Source: ICE, TradingView
View the full economic calendar
View the full economic calendar
-- Written by Matt Simpson
Follow Matt on Twitter @cLeverEdge
How to trade with City Index
You can trade with City Index by following these four easy steps:
- Open an account, or log in if you’re already a customer
• Open an account in the UK
• Open an account in Australia
• Open an account in Singapore
- Search for the market you want to trade in our award-winning platform
- Choose your position and size, and your stop and limit levels
- Place the trade
Related tags:



Open an account in minutes
Experience award-winning platforms with fast and secure execution, and enjoy tight spreads from 0.5 pts on FX and 0.3 pts on indices.
Economic calendar
Web Trader platform
Our sophisticated web-based platform is packed with features.
Related articles

Nasdaq 100 Coils Ahead of ASML Earnings as AI Leadership Faces a Test
The Nasdaq 100 consolidates ahead of ASML earnings as leadership fades, market breadth improves and traders await fresh clues on AI demand.

Nasdaq 100 Bulls Seek Swing Low, Though COT Positioning Lacks Conviction
Nasdaq 100 futures are trying to establish a swing low, but COT positioning shows traders remain cautious despite improving technical signals.

Crude Oil Finds Support at Its Pre-War Close, Gold Bounces and USD Retreats
Crude oil has surrendered all post-war gains, but key support, stretched positioning, a weaker US dollar and rebounding gold point to a potential recovery.
This report is intended for general circulation only. It should not be construed as a recommendation, or an offer (or solicitation of an offer) to buy or sell any financial products. The information provided does not take into account your specific investment objectives, financial situation or particular needs. Before you act on any recommendation that may be contained in this report, independent advice ought to be sought from a financial adviser regarding the suitability of the investment product, taking into account your specific investment objectives, financial situation or particular needs.
StoneX Financial Pte. Ltd., may distribute reports produced by its respective foreign entities or affiliates within the StoneX group of companies or third parties pursuant to an arrangement under Regulation 32C of the Financial Advisers Regulations. Where the report is distributed to a person in Singapore who is not an accredited investor, expert investor or an institutional investor (as defined in the Securities Futures Act), StoneX Financial Pte. Ltd. accepts legal responsibility to such persons for the contents of the report only to the extent required by law. Singapore recipients should contact StoneX Financial Pte. Ltd. at 6826 9988 for matters arising from, or in connection with the report.
In the case of all other recipients of this report, to the extent permitted by applicable laws and regulations neither StoneX Financial Pte. Ltd. nor its associated companies will be responsible or liable for any loss or damage incurred arising out of, or in connection with, any use of the information contained in this report and all such liability is hereby expressly disclaimed. No representation or warranty is made, express or implied, that the content of this report is complete or accurate.
StoneX Financial Pte. Ltd. is not under any obligation to update this report.
Trading CFDs carries a high level of risk that may not be suitable for some investors. Consider your investment objectives, level of experience, financial resources, risk appetite and other relevant circumstances carefully. The possibility exists that you could lose some or all of your investments, including your initial deposits. If in doubt, please seek independent expert advice. Visit www.forex.com/en-sg/terms-and-policies for the complete Risk Disclosure Statement.