



US Dollar, Yields Rally Post-Fed as USD/JPY Tests Resistance
US dollar and yields rally after hawkish Fed hold, with USD/JPY testing 160 resistance and DXY approaching key gap levels near 99.
Share this:

US bond yields surged and the US dollar was the strongest major currency on Wednesday after the Fed held rates and signalled just one 25bp cut ahead. While markets weren’t pricing in any cuts beforehand, the shift in Fed funds projections can still be seen as hawkish relative to the Fed’s prior outlook.
Jerome Powell also pushed back against political pressure, vowing to remain on the FOMC board to preserve its independence and describing Trump’s attacks as “unprecedented”.
The overall tone leans more hawkish than markets—and Trump—would have preferred, reinforcing expectations that the Fed is in no rush to ease policy despite lingering inflation risks.
View related analysis:
View related analysis:
Market Reaction: US Dollar, Yields and Equities
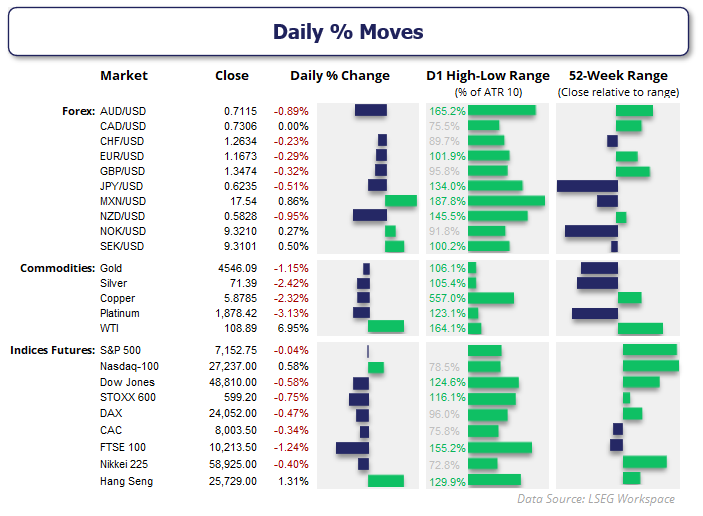
- Us 2-year yield rose 10.9bp to 3.95%, more than twice its average daily rise of 3.2bp over the past year while the 10-year yield hit 4.1%
- The US dollar was the strongest FX major, sending DXY (USD index) up 0.36% to a 12-day high
- AUD/USD and NZD/USD were the weakest majors, which were dragged lower alongside metals such as gold, copper
- Crude oil easily withstood US dollar strength with it looking increasingly likely the Straight of Hormoz will remain closed indefinitely
- Wall Street indices fell in the final hour of trade with Nasdaq futures down -0.7%, Dow Jones -0.5% and S&P 500 -0.4% into the close
US Dollar Index (DXY) Technical Analysis
USD Index Tests 99 Resistance as Momentum Builds
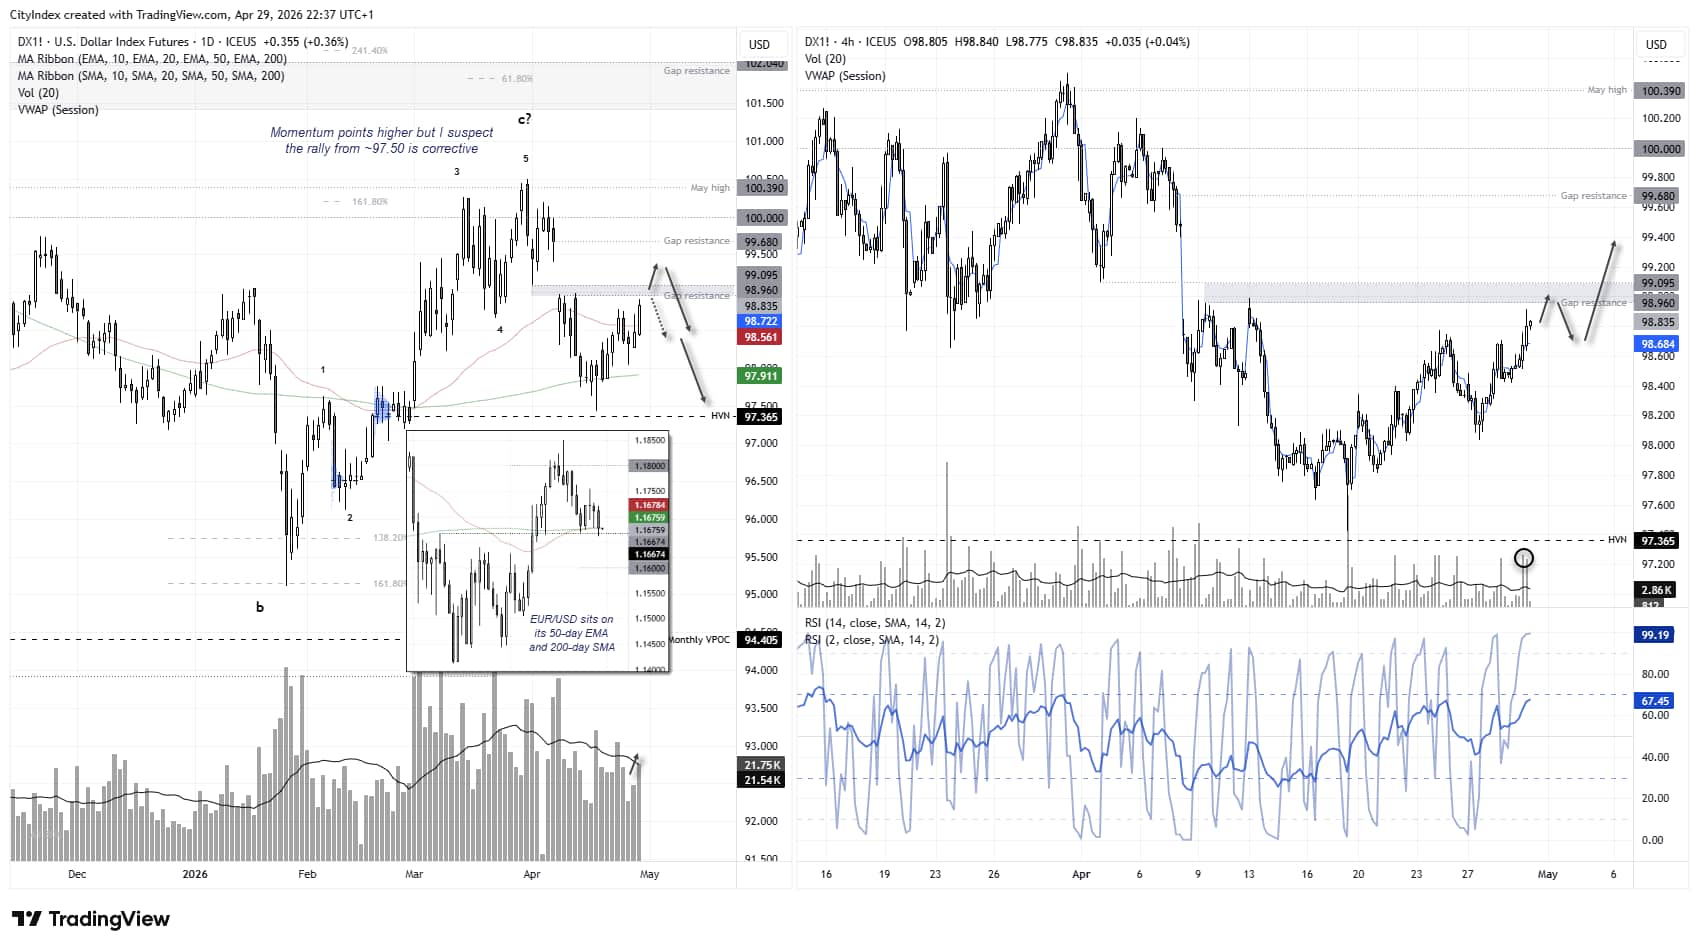
Momentum has turned higher for the US dollar, with the USD index pushing above last week’s high and testing gap resistance near the 99 handle.
Rising volume alongside prices suggests the move could extend in the near term, bringing 99.09 into focus and potentially a move into the gap towards 99.68.
However, EUR/USD is sitting on its 50-day EMA and 200-day SMA near key historical support. If this area holds, it could cap USD upside in the near term, making the euro a useful confirmation signal for dollar direction.


US Dollar Rally Looks Corrective Within Bearish Structure
While near-term momentum points higher, the broader outlook for the US dollar remains bearish in my view. I suspect a significant top formed on March 31, with the current rally from ~97.50 appearing corrective against that decline.
This keeps the focus on identifying a potential swing high on the daily chart, with EUR/USD likely providing confirmation if it forms a corresponding swing low.
Source: ICE, Forex.com, TradingView
USD/JPY Technical Analysis: US Dollar vs Japanese Yen
USD/JPY Breaks Above 160
The Japanese yen may not have been the weakest currency on Wednesday—that honour went to the Australian and New Zealand dollars—but its losses against the US dollar have produced some of the cleanest price action on USD/JPY among the majors.
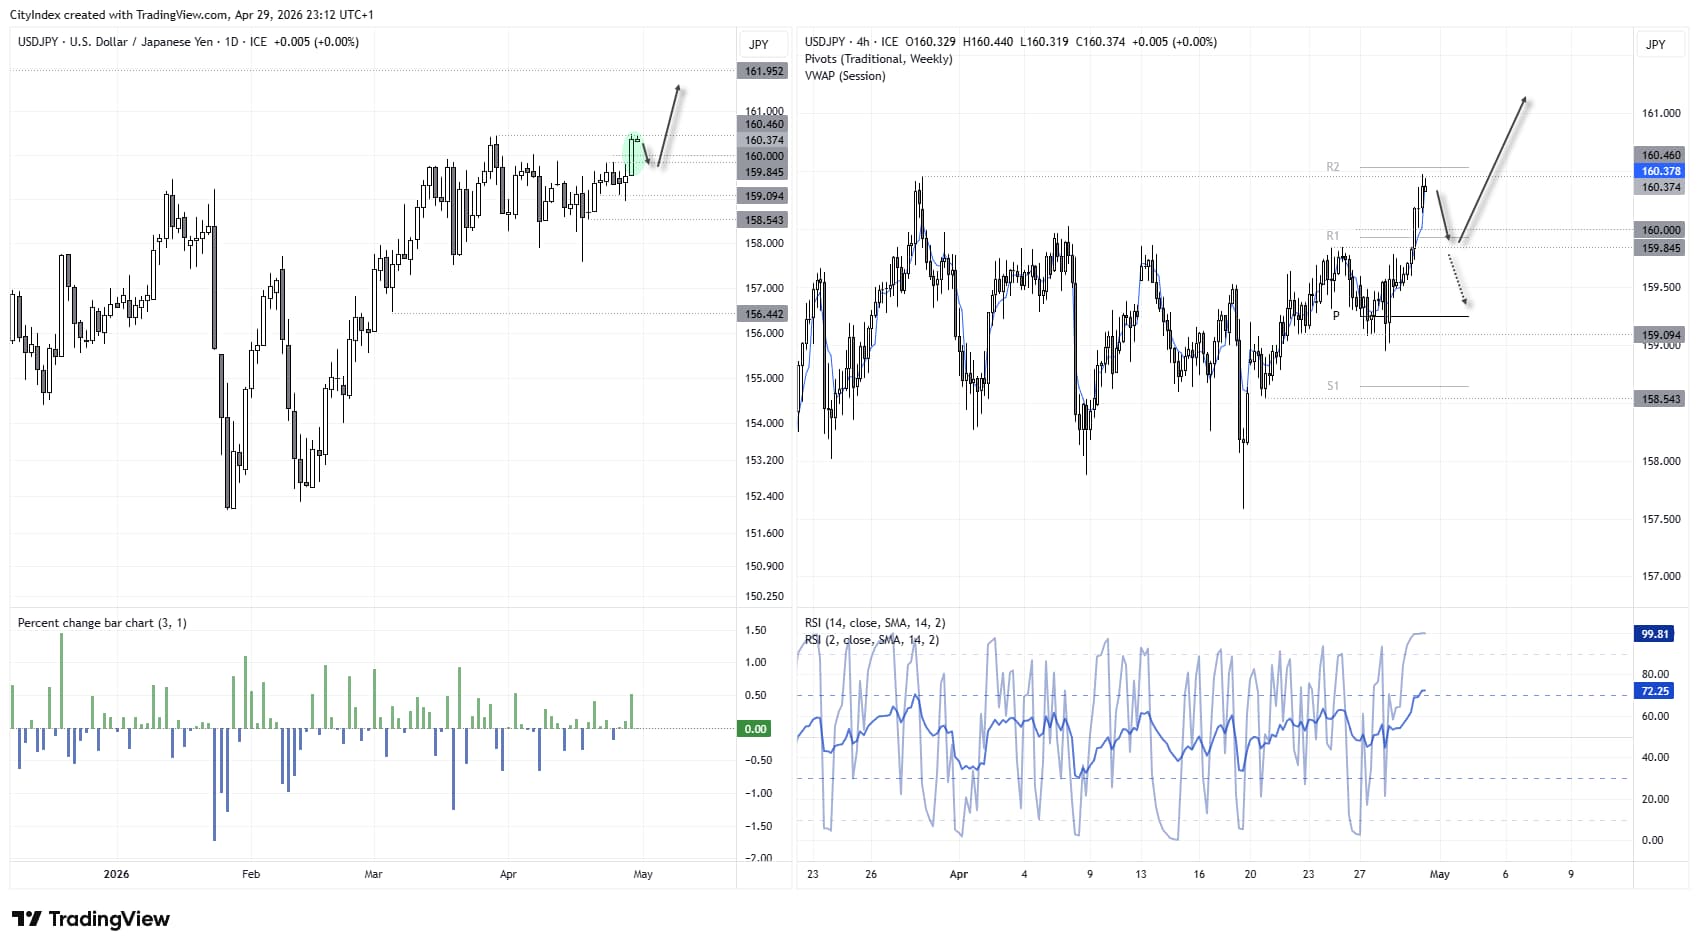
The 0.5% rise for USD/JPY marked its best day in 19 sessions and saw it close comfortably above 160 at a four-week high. This begs the question of whether we’ll see a breakout in today’s Asian session, although I feel compelled to urge caution.


160 Remains a Key Level
160 is a big enough level in its own right to break, but it has been closely watched for over a month and previously triggered a selloff on March 30 after just a single day above it—one day prior to the top on the US dollar index.
The 4-hour chart shows USD/JPY probed the March high but fell just short of the weekly R2 pivot point before retracing into the US close. With EUR/USD sitting on key support, a case could be made for a pause or minor retracement from current levels—even if USD/JPY seems destined to eventually break higher anyway.
Bullish Bias Holds Above 160
The trend on the daily chart is clearly bullish, and we’ve seen sufficient sideways trade to justify a breakout. We just need to clear the bump in the road around the March high first.
That could mean choppy trade or a pullback before liftoff. The bias remains bullish while USD/JPY holds above 160, as this level could be the difference between a minor dip or a deeper pullback.
Source: ICE, Forex.com, TradingView
View the full economic calendar
View the full economic calendar
-- Written by Matt Simpson
Follow Matt on Twitter @cLeverEdge
How to trade with City Index
You can trade with City Index by following these four easy steps:
- Open an account, or log in if you’re already a customer
• Open an account in the UK
• Open an account in Australia
• Open an account in Singapore
- Search for the market you want to trade in our award-winning platform
- Choose your position and size, and your stop and limit levels
- Place the trade
Related tags:
Latest market news




Open an account in minutes
Experience award-winning platforms with fast and secure execution, and enjoy tight spreads from 0.5 pts on FX and 0.3 pts on indices.
Economic calendar
Web Trader platform
Our sophisticated web-based platform is packed with features.
Related articles
EUR/USD weekly outlook: FOMC and ECB to set the tone
The current backdrop is modestly bearish. On Friday, the EUR/USD closed modestly lower, down for the third consecutive day. The pair also posted a weekly decline after staging a modest recovery attempt in the previous week. Out of the past 8 weeks, the EUR/USD has fallen on 6 occasions. There is not much supporting factors for the single currency right now. So, the upside remains capped.
USD/JPY Weekly Outlook: AI earnings could overshadow the Fed and BoJ
AI sentiment has become a major driver of US Treasury yields and USD/JPY. With Microsoft, Alphabet and Amazon reporting this week, central bank decisions may have competition for traders' attention.


USD/JPY Forecast: Is Rising Japanese Inflation Supporting the Yen?
As the trading week comes to an end, one of the most relevant developments in the FX market has been the renewed strength of the Japanese yen. This can be seen in the recent performance of USD/JPY, which has fallen nearly 1.0% over the last two trading sessions, highlighting a meaningful recovery in the Japanese currency against the U.S. dollar.

This report is intended for general circulation only. It should not be construed as a recommendation, or an offer (or solicitation of an offer) to buy or sell any financial products. The information provided does not take into account your specific investment objectives, financial situation or particular needs. Before you act on any recommendation that may be contained in this report, independent advice ought to be sought from a financial adviser regarding the suitability of the investment product, taking into account your specific investment objectives, financial situation or particular needs.
StoneX Financial Pte. Ltd., may distribute reports produced by its respective foreign entities or affiliates within the StoneX group of companies or third parties pursuant to an arrangement under Regulation 32C of the Financial Advisers Regulations. Where the report is distributed to a person in Singapore who is not an accredited investor, expert investor or an institutional investor (as defined in the Securities Futures Act), StoneX Financial Pte. Ltd. accepts legal responsibility to such persons for the contents of the report only to the extent required by law. Singapore recipients should contact StoneX Financial Pte. Ltd. at 6826 9988 for matters arising from, or in connection with the report.
In the case of all other recipients of this report, to the extent permitted by applicable laws and regulations neither StoneX Financial Pte. Ltd. nor its associated companies will be responsible or liable for any loss or damage incurred arising out of, or in connection with, any use of the information contained in this report and all such liability is hereby expressly disclaimed. No representation or warranty is made, express or implied, that the content of this report is complete or accurate.
StoneX Financial Pte. Ltd. is not under any obligation to update this report.
Trading CFDs carries a high level of risk that may not be suitable for some investors. Consider your investment objectives, level of experience, financial resources, risk appetite and other relevant circumstances carefully. The possibility exists that you could lose some or all of your investments, including your initial deposits. If in doubt, please seek independent expert advice. Visit www.forex.com/en-sg/terms-and-policies for the complete Risk Disclosure Statement.