







Nasdaq 100 Breaks Out Into Bull Market, Tops Wall Street Rally
Nasdaq 100 futures erased a 75-day bear market in just 23 sessions. Is this the start of a new bullish cycle—or just another bear market bounce?
Share this:

View related analysis:
- USD/JPY, USD/CAD, AUD/USD Outlook: US Dollar Rallies on Tariff Pause
- ASX 200 Slips Amid Cautious Sentiment Ahead of Key US Data
- AUD/USD, Nasdaq Soar as Trump Blinks First, Sparking Epic Market U-Turn
- ASX 200 Hang Seng Analysis: Bears Shaken Out From Wall Street Surge
View related analysis:
- USD/JPY, USD/CAD, AUD/USD Outlook: US Dollar Rallies on Tariff Pause
- ASX 200 Slips Amid Cautious Sentiment Ahead of Key US Data
- AUD/USD, Nasdaq Soar as Trump Blinks First, Sparking Epic Market U-Turn
- ASX 200 Hang Seng Analysis: Bears Shaken Out From Wall Street Surge
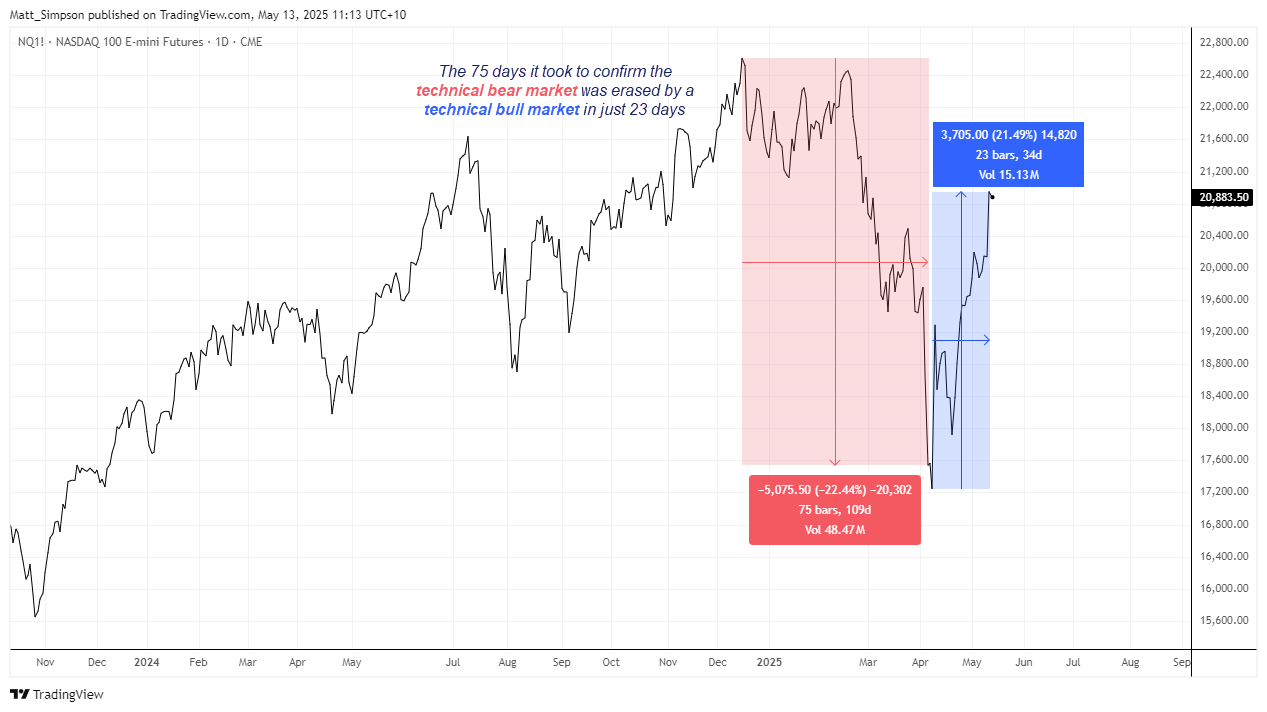
Using the daily close chart, the Nasdaq 100 futures market set its most recent record high on Monday, 16 December 2024. It wasn’t until late February that bearish momentum truly took hold, but by 4 April the Nasdaq had confirmed a technical bear market—defined as a 20% decline from the recent high on a closing basis. That marked a span of 75 trading days between its peak and bear market confirmation. Remarkably, that entire bear market has now been erased in just 23 trading days.
If Nasdaq bulls can unwind a bear market in a third of the time it took to form, perhaps the cycle low is already in place.
On the flip side, many a market veteran might be quick to point out that bear market bounces—and volatile rallies within a broader downtrend—have a habit of sucker-punching bulls into believing the worst is over, only for momentum to reverse lower once again. That said, with Trump’s trade war quickly winding down, I see a reasonable case for the Nasdaq and its Wall Street peers to reach new record highs before any fresh tests of cycle lows.
Nasdaq 100 Futures Positioning (NQ): Weekly COT Report Analysis
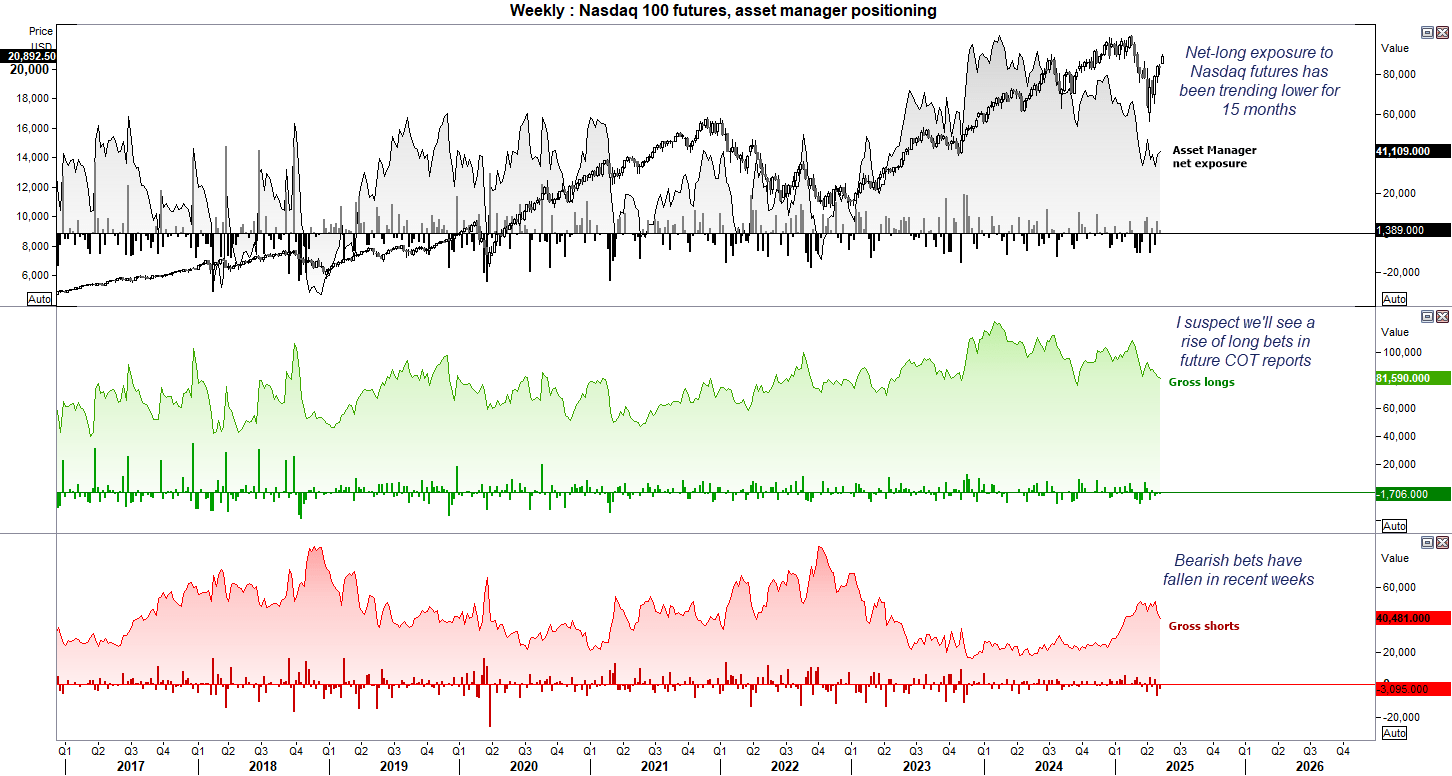
With Nasdaq futures ripping higher on positive trade headlines, the case builds for asset managers to get behind the bullish move. Net-long exposure has been trending lower for the past 15 months but has stabilised around 35,000 contracts in recent weeks. Gross shorts have also diminished, signalling a lack of conviction to bet against the tech sector. I believe asset managers may now be tempted to rejoin the party.
Nasdaq 100 Futures Technical Analysis: US Tech Index Outlook
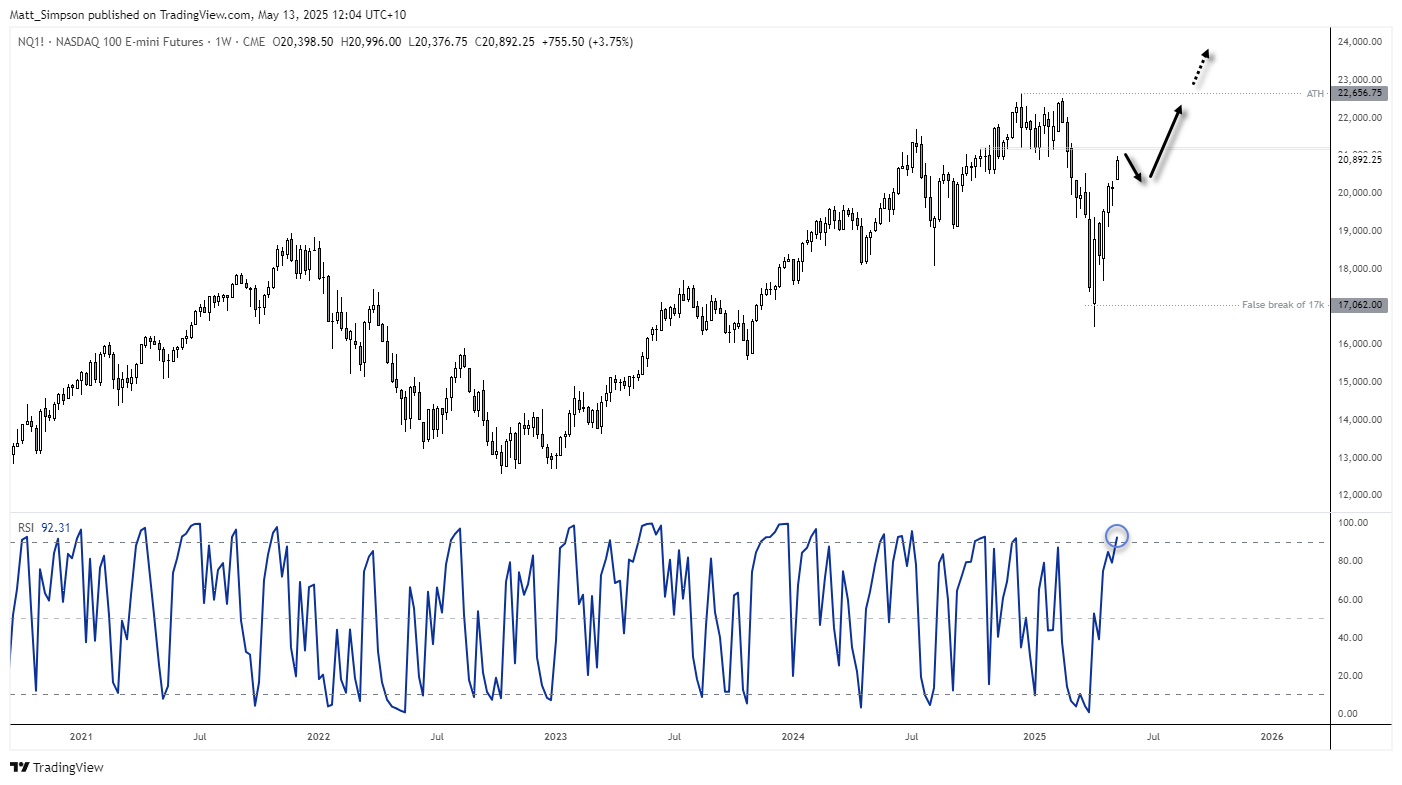
The low-to-high range of the Nasdaq is now 27% from the April low and the weekly RSI (2) has moved into the overbought level. However, with 21k and a support cluster ~21,200 nearby, perhaps we are nearing the end of this initial bounce. While I favour a break to a new high in the coming weeks or months, the preference is to seek dips and not chase the move. 20k seems like an obvious support level on this timeframe, should it be allowed to retrace this far.
Nasdaq 100 Futures Technical Analysis: Daily Chart
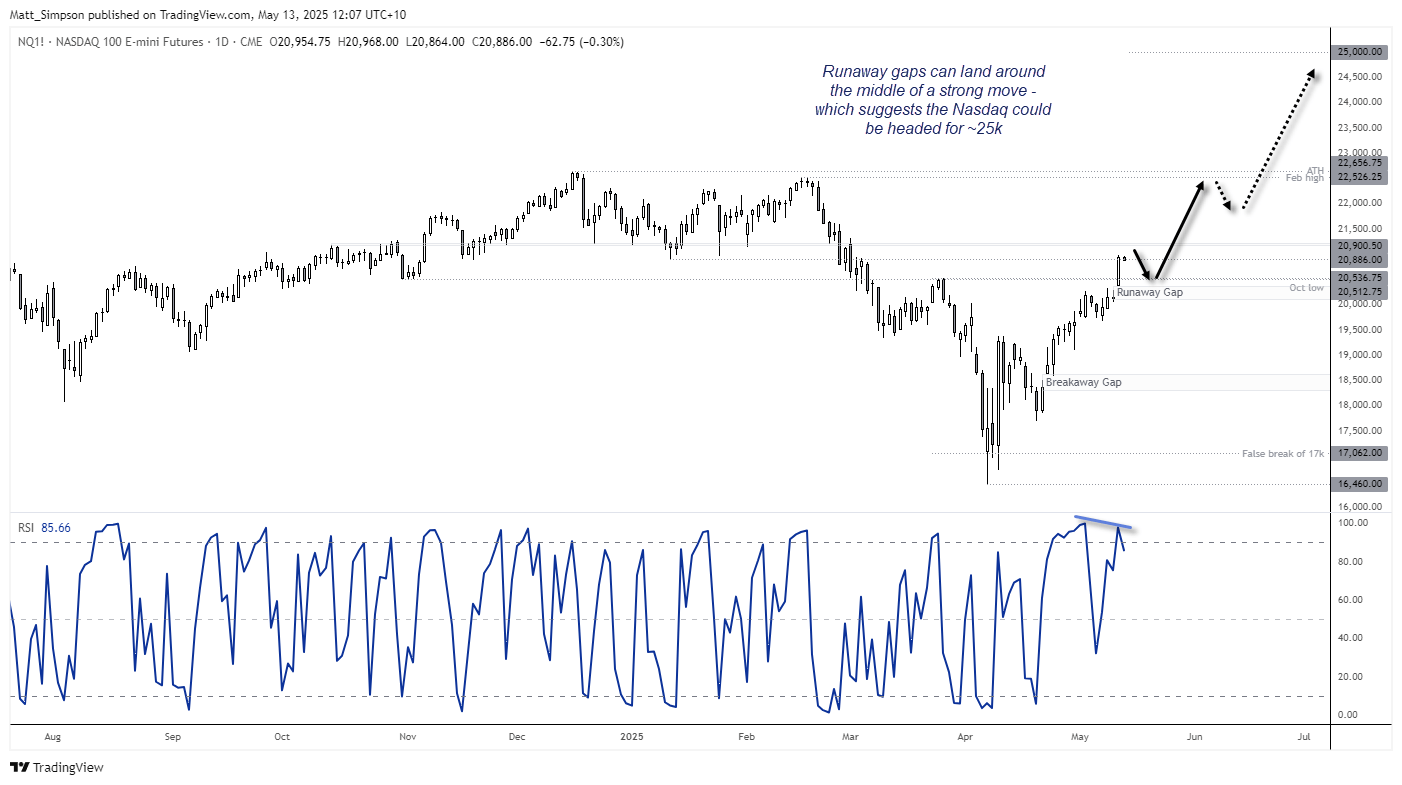
The daily chart shows an upside gap, its second such move since the April low. The breakaway gap on April 22 marks the required shift in sentiment, back when traders were still expecting the Nasdaq to trend lower. That means Monday’s gap could be the runaway gap – typically found around the middle of a trending move. If so, it implies the Nasdaq could be headed for 25k.
Take note of the bearish divergence on the daily RSI (2) to warn of potential weakness. Though I expect any pullback to be shallow given the runaway gap and strong bullish candle on Monday.
-- Written by Matt Simpson
Follow Matt on Twitter @cLeverEdge
How to trade with City Index
You can trade with City Index by following these four easy steps:
- Open an account, or log in if you’re already a customer
• Open an account in the UK
• Open an account in Australia
• Open an account in Singapore
- Search for the market you want to trade in our award-winning platform
- Choose your position and size, and your stop and limit levels
- Place the trade
Related tags:
Latest market news




Open an account in minutes
Experience award-winning platforms with fast and secure execution, and enjoy tight spreads from 0.5 pts on FX and 0.3 pts on indices.
Economic calendar
Web Trader platform
Our sophisticated web-based platform is packed with features.
Related articles
S&P 500, Nasdaq 100 Claw Back But NVDA Cloud Looms Overhead
Last week was green for both the Nasdaq and S&P 500 but given the sell-off that led into that bounce there’s still a very real question as to whether bears still have a statement to make. And the NVDA situation presents a very real threat.

US dollar forecast: USD/JPY and USD/CHF in focus | Forex Friday
Sticky US inflation and a hawkish Fed have kept the dollar firm across the majors, with USD/JPY pressing on the 160 handle. Here are the levels that matter on USD/JPY and USD/CHF as next week's retail sales, Nvidia results and FOMC minutes approach.


Gold outlook: seasonal tailwind offers hope with XAU/USD below $4,000
A historically stronger seasonal window and steady central bank buying are offering gold some hope after its slide to a fresh 2026 low. Reclaiming the 4,000 mark is the first sign that the metal may have found a floor.
This report is intended for general circulation only. It should not be construed as a recommendation, or an offer (or solicitation of an offer) to buy or sell any financial products. The information provided does not take into account your specific investment objectives, financial situation or particular needs. Before you act on any recommendation that may be contained in this report, independent advice ought to be sought from a financial adviser regarding the suitability of the investment product, taking into account your specific investment objectives, financial situation or particular needs.
StoneX Financial Pte. Ltd., may distribute reports produced by its respective foreign entities or affiliates within the StoneX group of companies or third parties pursuant to an arrangement under Regulation 32C of the Financial Advisers Regulations. Where the report is distributed to a person in Singapore who is not an accredited investor, expert investor or an institutional investor (as defined in the Securities Futures Act), StoneX Financial Pte. Ltd. accepts legal responsibility to such persons for the contents of the report only to the extent required by law. Singapore recipients should contact StoneX Financial Pte. Ltd. at 6826 9988 for matters arising from, or in connection with the report.
In the case of all other recipients of this report, to the extent permitted by applicable laws and regulations neither StoneX Financial Pte. Ltd. nor its associated companies will be responsible or liable for any loss or damage incurred arising out of, or in connection with, any use of the information contained in this report and all such liability is hereby expressly disclaimed. No representation or warranty is made, express or implied, that the content of this report is complete or accurate.
StoneX Financial Pte. Ltd. is not under any obligation to update this report.
Trading CFDs carries a high level of risk that may not be suitable for some investors. Consider your investment objectives, level of experience, financial resources, risk appetite and other relevant circumstances carefully. The possibility exists that you could lose some or all of your investments, including your initial deposits. If in doubt, please seek independent expert advice. Visit www.forex.com/en-sg/terms-and-policies for the complete Risk Disclosure Statement.