





S&P 500 Outlook: SPX Continues to Retreat from All-Time Highs
The U.S. equity index has posted a drop of over 1% across the last four trading sessions, amid a backdrop of rising market uncertainty.
Share this:

The U.S. equity index has posted a drop of over 1% across the last four trading sessions, amid a backdrop of rising market uncertainty. For now, the bearish bias remains firmly in place, as growing doubts emerge around whether interest rate cuts in the U.S. will happen soon, alongside a gradual deterioration in sentiment indicators. If these factors persist, downward pressure could gain further momentum in the short term.
Are rate cuts approaching?
Much of the recent rally in the SPX has been supported by expectations of a potential rate cut from the Federal Reserve. Lower interest rates across the U.S. would translate into reduced borrowing costs, which in turn could boost domestic consumption and support the operating performance of key companies in the index. This could help consolidate a more optimistic growth outlook, serving as a catalyst for a stronger recovery in equities in the short term.
This expectation is already priced in by the CME Group’s probability model, which currently shows an 84.9% chance that the Fed will cut rates from 4.5% to 4.25% at its September 17 meeting.
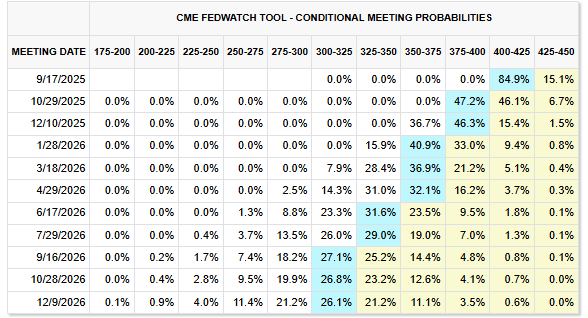
Source: CMEGroup
However, uncertainty has also grown over whether such cuts will materialize or if the Fed will instead stick to a neutral stance. This week, the Jackson Hole Symposium will be held, and Fed Chair Jerome Powell is scheduled to speak on Friday, August 22. His comments may offer clues about the future of the rate cycle, which has increased market caution heading into the event.
This shift is already visible in the performance of the index’s top five stocks, which have recently declined: Nvidia -3.36%, Microsoft -1.51%, Apple -0.3%, Amazon -1.72%, and Meta -2.22%, respectively.
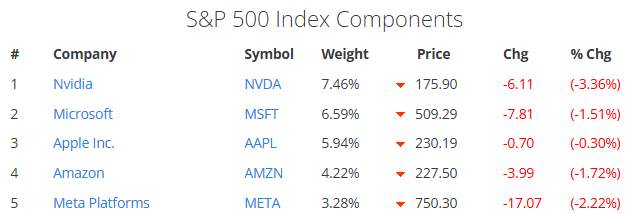
Source: Slickcharts
As Jackson Hole approaches, markets may find a clearer direction. If a short-term rate cut is not confirmed, investor confidence may take another hit, weakening sentiment among major S&P 500 constituents and fueling further bearish momentum.
What About Market Sentiment?
Investor sentiment in the equity markets has also started to weaken, partly due to uncertainty surrounding monetary policy. According to the AAII Investor Sentiment Survey, only 29.9% of investors hold a bullish view of the market, while 24.0% are neutral and 46.2% hold a bearish outlook for the next six months.
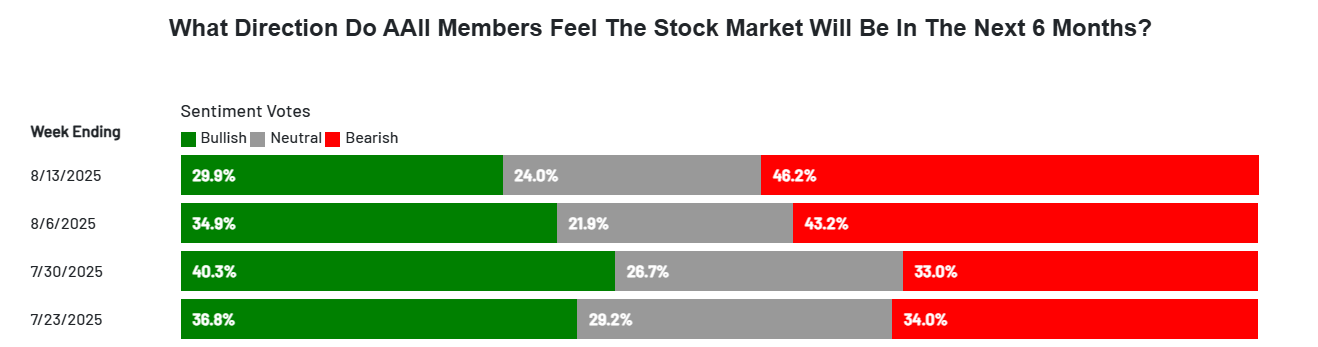
Source: AAII
For now, as sentiment continues to deteriorate gradually, it's likely that demand for exposure to the SPX will keep declining. This could support persistent selling pressure on the index over the near term.
S&P 500 Technical Outlook
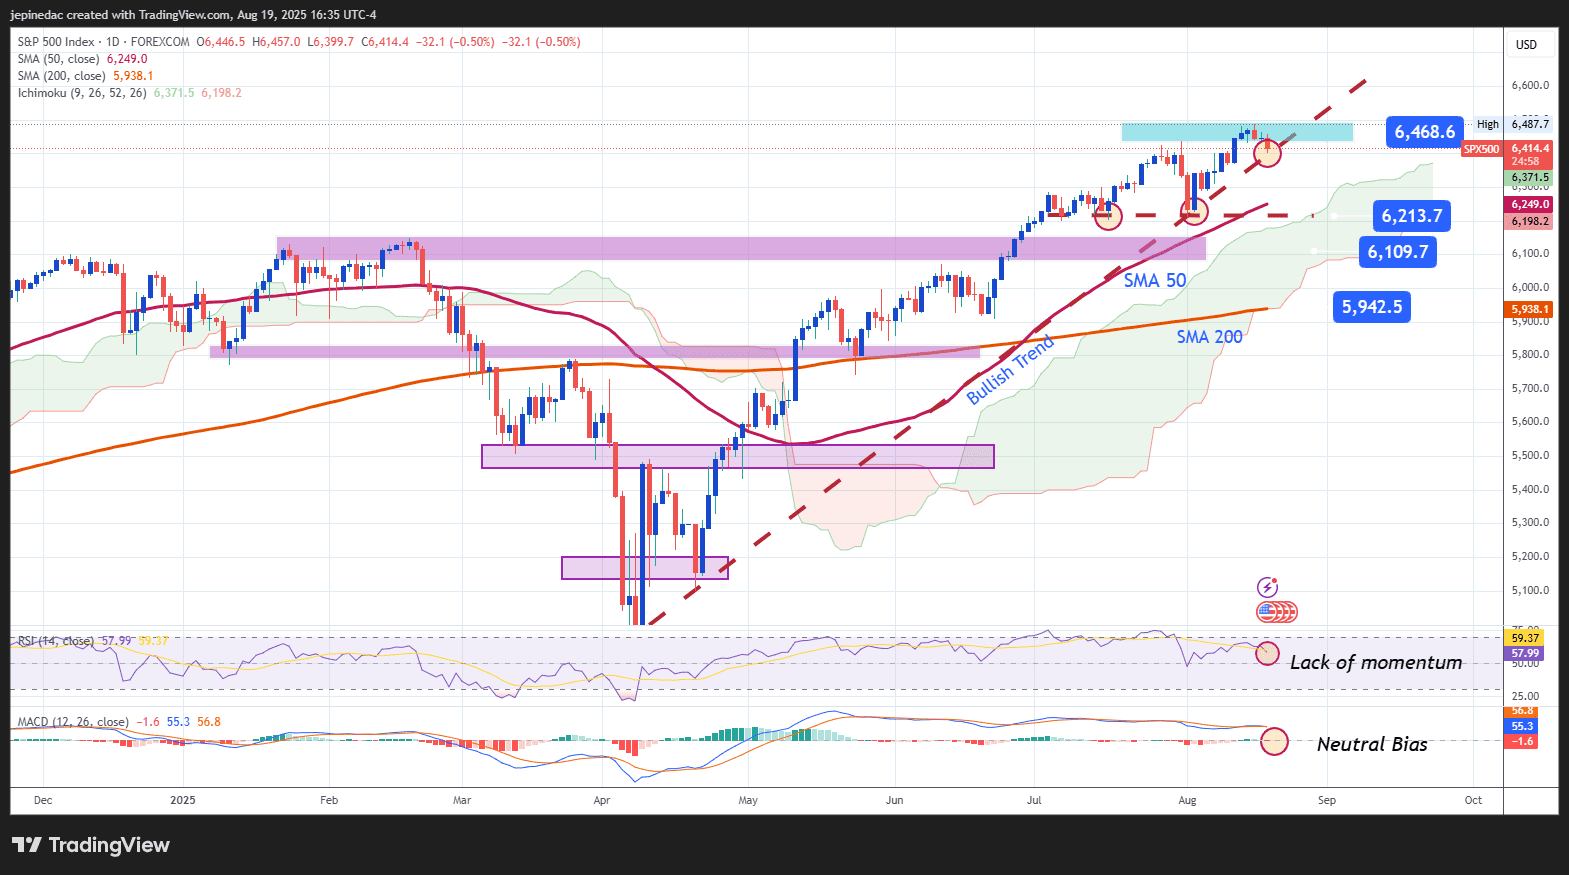
Source: StoneX, Tradingview
- Uptrend Remains but Signs of Fatigue Appear: Despite recent corrections, the index still retains its broader bullish structure, with no confirmed technical breakdown yet. However, growing neutrality in momentum has started to cap further gains. If this lack of direction persists, the sustainability of the current uptrend may come into question.
- RSI: The Relative Strength Index continues to show a steady downward slope, approaching the neutral 50 line, which indicates a loss of bullish momentum. If the RSI continues to decline, the short-term bias could turn negative.
- MACD: The MACD histogram has hovered near the zero line for several sessions, reflecting a lack of clear direction. This suggests that the market is in a transitional phase, with a new directional bias potentially emerging in the coming days.
Key Levels to Watch:
- 6,468 – Major Resistance: This level marks the all-time high and remains the most important short-term barrier. A confirmed breakout above this zone could reignite bullish momentum and open the door to a new upward phase.
- 6,213 – Near-Term Support: This level is tied to the recent lows and overlaps with the 50-period moving average. A break below it could represent an early bearish signal, threatening the current bullish trend on the chart.
- 6,109 – Critical Support: Located in a neutrality zone observed in February, this support is technically significant. If price falls below this area, it could confirm the start of a more established downtrend.
Written by Julian Pineda, CFA – Market Analyst
Follow him on: @julianpineda25
Related tags:



Open an account in minutes
Experience award-winning platforms with fast and secure execution, and enjoy tight spreads from 0.5 pts on FX and 0.3 pts on indices.
Economic calendar
Web Trader platform
Our sophisticated web-based platform is packed with features.
Related articles

Dow Jones Slide Shows What Rate Hike Bets Mean for Stocks
The Dow Jones support breakdown shows rising bond yields and rate hike bets hitting U.S. stocks while tech giants prop up the Nasdaq.


Dow Jones forecast: Stock markets under pressure from multiple sources
When looking at the major tech-heavy US indices like the S&P 500 or the Nasdaq 100, you wouldn’t think that the stock market is particularly weak. Yet, beneath the surface, the market is far from healthy right now. Investors are evidently just piling into the big tech and AI names, and as a result, market breadth is deteriorating. Other indices like the small cap Russell 2000 and the Dow Jones are starting to reflect that weakness.

Nikkei breakout accelerates as yen weakness returns
Nikkei has started October with a powerful breakout, helped by renewed yen weakness and strong upside momentum
This report is intended for general circulation only. It should not be construed as a recommendation, or an offer (or solicitation of an offer) to buy or sell any financial products. The information provided does not take into account your specific investment objectives, financial situation or particular needs. Before you act on any recommendation that may be contained in this report, independent advice ought to be sought from a financial adviser regarding the suitability of the investment product, taking into account your specific investment objectives, financial situation or particular needs.
StoneX Financial Pte. Ltd., may distribute reports produced by its respective foreign entities or affiliates within the StoneX group of companies or third parties pursuant to an arrangement under Regulation 32C of the Financial Advisers Regulations. Where the report is distributed to a person in Singapore who is not an accredited investor, expert investor or an institutional investor (as defined in the Securities Futures Act), StoneX Financial Pte. Ltd. accepts legal responsibility to such persons for the contents of the report only to the extent required by law. Singapore recipients should contact StoneX Financial Pte. Ltd. at 6826 9988 for matters arising from, or in connection with the report.
In the case of all other recipients of this report, to the extent permitted by applicable laws and regulations neither StoneX Financial Pte. Ltd. nor its associated companies will be responsible or liable for any loss or damage incurred arising out of, or in connection with, any use of the information contained in this report and all such liability is hereby expressly disclaimed. No representation or warranty is made, express or implied, that the content of this report is complete or accurate.
StoneX Financial Pte. Ltd. is not under any obligation to update this report.
Trading CFDs carries a high level of risk that may not be suitable for some investors. Consider your investment objectives, level of experience, financial resources, risk appetite and other relevant circumstances carefully. The possibility exists that you could lose some or all of your investments, including your initial deposits. If in doubt, please seek independent expert advice. Visit www.forex.com/en-sg/terms-and-policies for the complete Risk Disclosure Statement.