


USD/JPY and AUD/JPY Test Key Support as Japanese Yen Strengthens
Japanese yen strength pressures USD/JPY below 155 and drags AUD/JPY toward key support as traders assess downside risks.
Share this:

The Japanese yen is regaining traction, pushing USD/JPY and AUD/JPY toward key technical support levels. A softer US dollar backdrop and renewed focus on volatility have dragged USD/JPY below the closely watched 155 handle, while AUD/JPY has rolled over from multi-year highs. With both pairs probing pivotal levels, traders are now assessing whether yen strength extends or gives way to a corrective bounce.
View related analysis:
View related analysis:
Yen Strength Pressures USD/JPY and AUD/JPY at Key Support
November’s Nonfarm Payrolls report was mixed, though it slightly favoured doves as unemployment rose 0.2 percentage points to a four-year high of 4.6%. This marks a fourth consecutive monthly increase — the worst run since January 2009. While the 64k jobs added beat expectations of 50k and marked a sharp rebound from the prior -1.5k print – prompting some positive headlines for job growth - the broader trend is clearly pointing lower.
The US dollar was the weakest major currency on the day, with the Australian dollar a close second. The US dollar index traded down to a 42-day low before recouping around two-thirds of the session’s losses, leaving a potential bullish hammer on the daily chart.
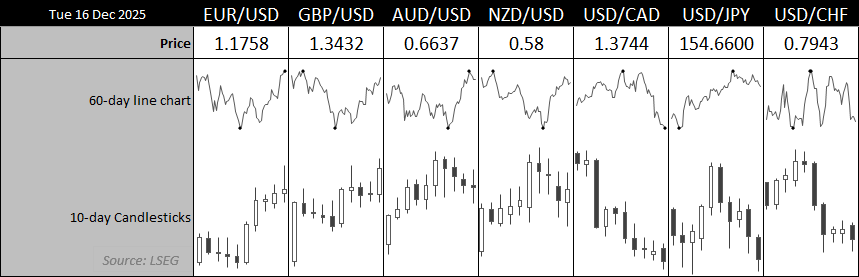
Chart analysis by Matt Simpson - source: LSEG
- EUR/USD formed a prominent shooting star near the 1.18 handle on the daily chart, hinting at bullish exhaustion and flagging the risk of a near-term retracement
- USD/CAD fell to a 65-day low, though support is nearby, with the August and September lows less than half a day’s average daily range away
- GBP/USD reached a 42-day high, with the British pound the strongest FX major on Tuesday
- USD/JPY slipped back below 155, leaving the October high in focus for bears to challenge
- AUD/USD fell for a fourth straight session, though a wide-legged doji formed and price held above the October high, hinting at a near-term swing low


USD/JPY Technical Analysis: US Dollar vs Japanese Yen
USD/JPY has posted its first daily close below 155 in a month. The level has drawn close attention since a former MOF official described it as a “line in the sand” for potential currency intervention a couple of years ago. That does not make 155 a hard trigger when crossed, but the risk of intervention increases if USD/JPY accelerates higher through it — particularly as the BOJ closely monitors volatility.
Regardless, the market clearly has a memory. The 155 handle has repeatedly acted as both support and resistance, making it a key reference point for yen traders. As such, a daily close beneath it is worth noting.
USD/JPY is now holding above last week’s low, though a break beneath it would likely open the door to a deeper retracement. The monthly S1 pivot sits near 153.28, making it a viable downside target for bears — or a level where bulls may reassess dips if downside momentum persists.
Still, a falling wedge is forming on the 4-hour chart, while a bearish divergence has developed on the RSI (2) within oversold territory. This leaves scope for a near-term bounce while prices hold above 154.34.
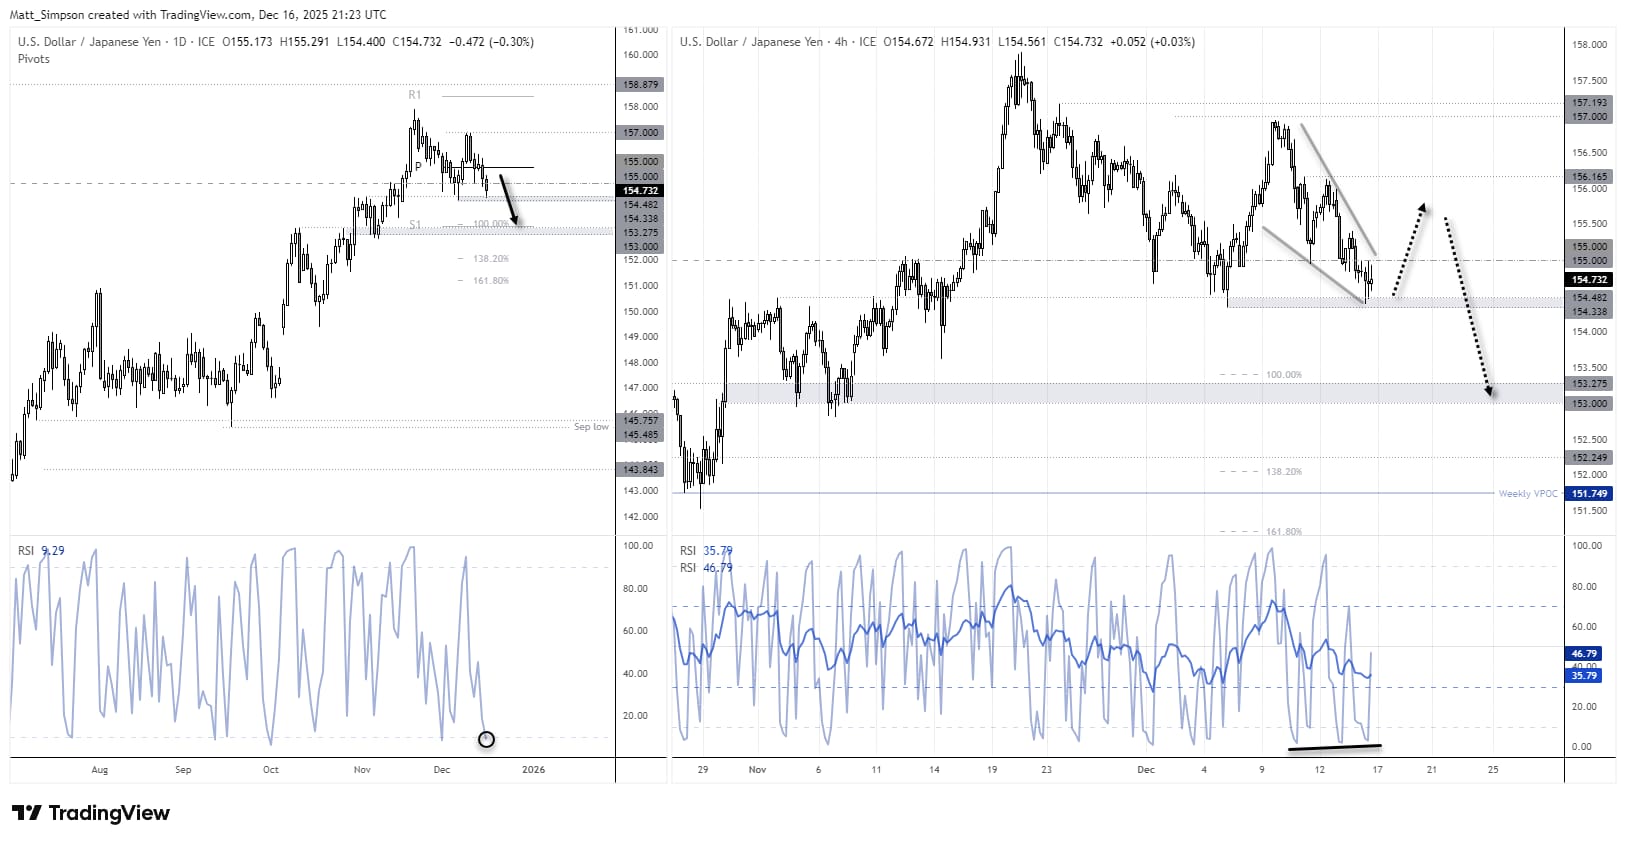
Chart analysis by Matt Simpson - data source: TradingView USD/JPY


AUD/JPY Technical Analysis: Australian Dollar vs Japanese Yen
The Australian dollar remains in a strong uptrend against the Japanese yen, with AUD/JPY reaching a 16-year high last week. However, the 2008 high proved a tough nut to crack, triggering a much-needed pullback. That retracement has produced five consecutive bearish daily candles — the first such sequence since August 2024.
Support is close at hand, with the November 2024 high, December VPOC and 20-day EMA clustered around the 102.50 area, making it a pivotal level for AUD/JPY traders. With the daily RSI (2) now stretched and a bullish pin bar alongside bullish divergence visible on the 4-hour chart, the pair may be able to muster a near-term bounce back towards the 103 handle.
That said, bearish momentum remains evident. Traders should stay alert to the risk of a break lower, which could open the door to a move towards the 102 handle or the 101.51 low.
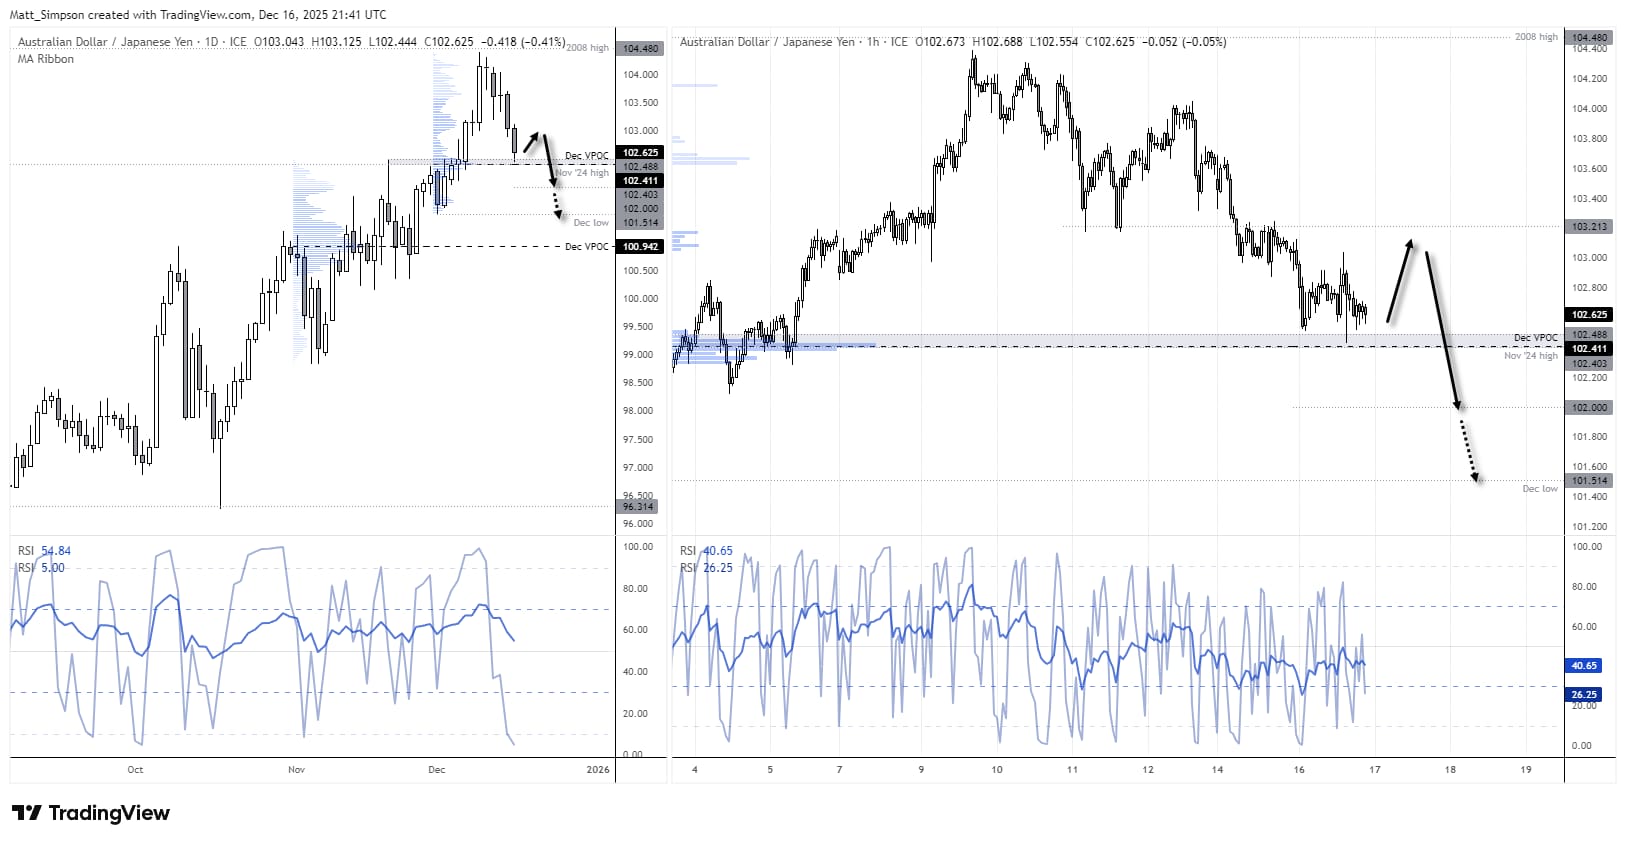
Chart analysis by Matt Simpson - source: TradingView AUD/JPY
View the full economic calendar
View the full economic calendar
-- Written by Matt Simpson
Follow Matt on Twitter @cLeverEdge
How to trade with City Index
You can trade with City Index by following these four easy steps:
- Open an account, or log in if you’re already a customer
• Open an account in the UK
• Open an account in Australia
• Open an account in Singapore
- Search for the market you want to trade in our award-winning platform
- Choose your position and size, and your stop and limit levels
- Place the trade
Related tags:
Latest market news




Open an account in minutes
Experience award-winning platforms with fast and secure execution, and enjoy tight spreads from 0.5 pts on FX and 0.3 pts on indices.
Economic calendar
Web Trader platform
Our sophisticated web-based platform is packed with features.
Related articles
US Dollar Bulls Hold Firm, but Euro Warns of Squeeze Risk | COT Report
US dollar bulls remain firmly positioned, but record euro shorts have failed to break EUR/USD support, raising the risk of a short-covering rally.
USD/CAD reversal risk builds as central bank showdown looms
USD/CAD has delivered a bullish reversal signal from established support, just as traders prepare for Fed and BoC decisions. Aggressive Canadian rate hike expectations and conflicting momentum signals make the coming session important.

Australian Dollar Outlook: AUD/USD Screams Sentiment Extreme Into Fed, CPI
AUD/USD rebounds despite record bearish futures positioning, with Australian Q3 CPI and the Fed meeting threatening to trigger another short squeeze.
This report is intended for general circulation only. It should not be construed as a recommendation, or an offer (or solicitation of an offer) to buy or sell any financial products. The information provided does not take into account your specific investment objectives, financial situation or particular needs. Before you act on any recommendation that may be contained in this report, independent advice ought to be sought from a financial adviser regarding the suitability of the investment product, taking into account your specific investment objectives, financial situation or particular needs.
StoneX Financial Pte. Ltd., may distribute reports produced by its respective foreign entities or affiliates within the StoneX group of companies or third parties pursuant to an arrangement under Regulation 32C of the Financial Advisers Regulations. Where the report is distributed to a person in Singapore who is not an accredited investor, expert investor or an institutional investor (as defined in the Securities Futures Act), StoneX Financial Pte. Ltd. accepts legal responsibility to such persons for the contents of the report only to the extent required by law. Singapore recipients should contact StoneX Financial Pte. Ltd. at 6826 9988 for matters arising from, or in connection with the report.
In the case of all other recipients of this report, to the extent permitted by applicable laws and regulations neither StoneX Financial Pte. Ltd. nor its associated companies will be responsible or liable for any loss or damage incurred arising out of, or in connection with, any use of the information contained in this report and all such liability is hereby expressly disclaimed. No representation or warranty is made, express or implied, that the content of this report is complete or accurate.
StoneX Financial Pte. Ltd. is not under any obligation to update this report.
Trading CFDs carries a high level of risk that may not be suitable for some investors. Consider your investment objectives, level of experience, financial resources, risk appetite and other relevant circumstances carefully. The possibility exists that you could lose some or all of your investments, including your initial deposits. If in doubt, please seek independent expert advice. Visit www.forex.com/en-sg/terms-and-policies for the complete Risk Disclosure Statement.