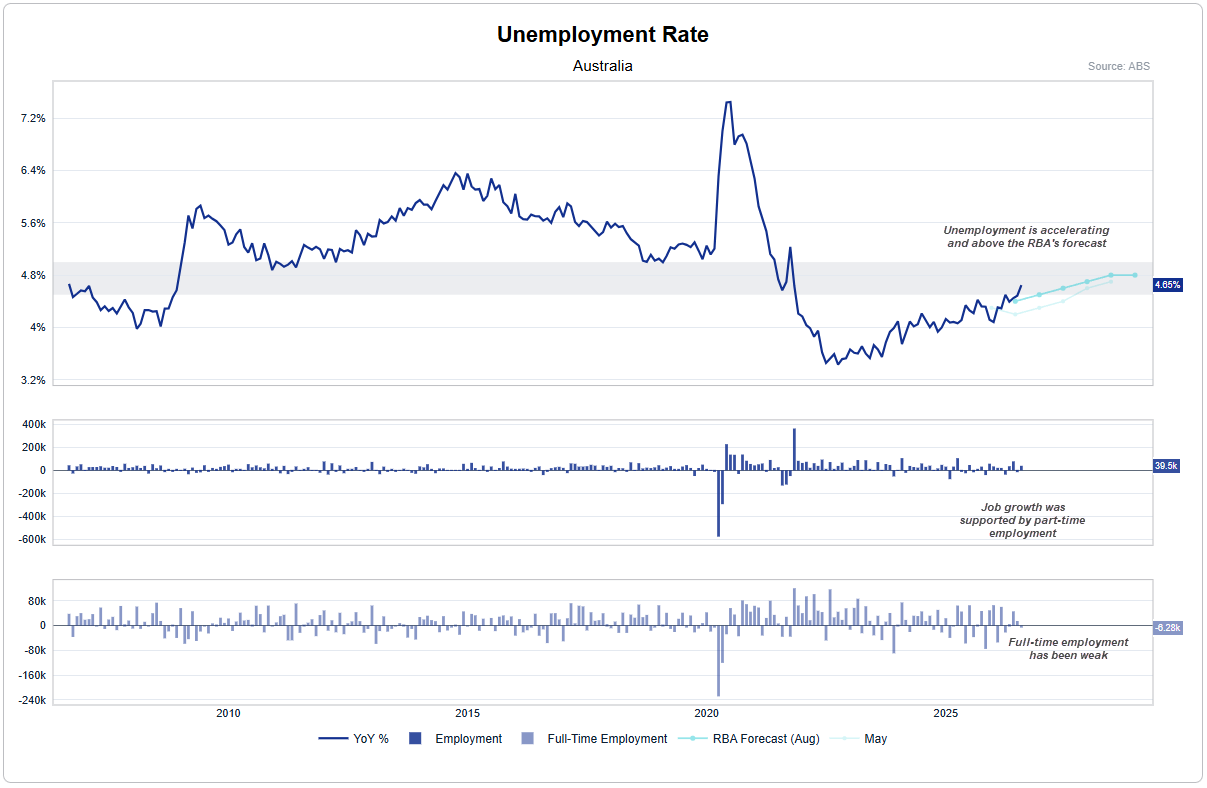
The Australian dollar is showing signs of vulnerability against the US dollar and Japanese yen, with bearish inverted hammer candles emerging on both AUD/USD and AUD/JPY. A potential swing high near 70c on AUD/USD adds to the downside risks ahead of Australia's employment report, particularly if unemployment rises faster than the RBA expects.
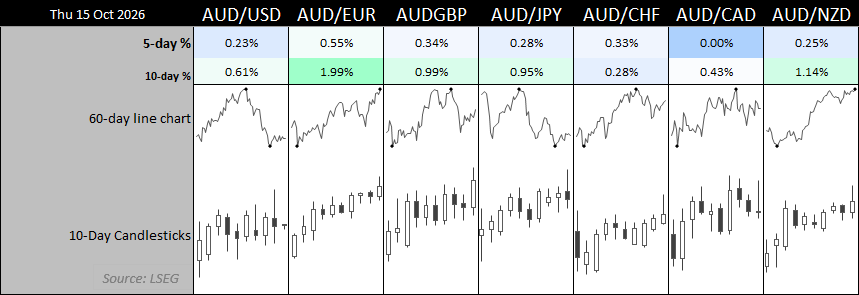
View related analysis:
- AUD/USD Q4 Outlook: RBA and Fed Hikes Set the Tone
- How to Read the COT Report to Track Forex Market Sentiment
- Gold Hints at Quiet Accumulation Despite Persistent US Dollar Strength
- Swissy Attracts Safe-Haven Bets, AUD Shorts Surge to Record High | COT report
AUD/USD and AUD/JPY Face Bearish Reversal Risks Ahead of Australian Jobs Data
AUD/USD Technical Analysis: Australian Dollar vs US Dollar
While we have time on our sides to see if that is indeed a large head and shoulders top in play on the weekly charts, AUD/USD is setting up for a potential swing high around 70c.
The daily chart shows a volatile inverted hammer formed on the daily chart, with a false break of its 20—day EMA and the 20-day capping the daily high as resistance. With a high-to-low range of 0.9%, it marked a 1-standard deviation range and its most volatile in eight. The face it still closed lower despite much of that range being earlier in the day plays to the advantage of bears, as it could realign momentum with the higher-timeframe head and shoulders pattern.
For now, perhaps we’re simply looking for a move down to 69c near its October low.
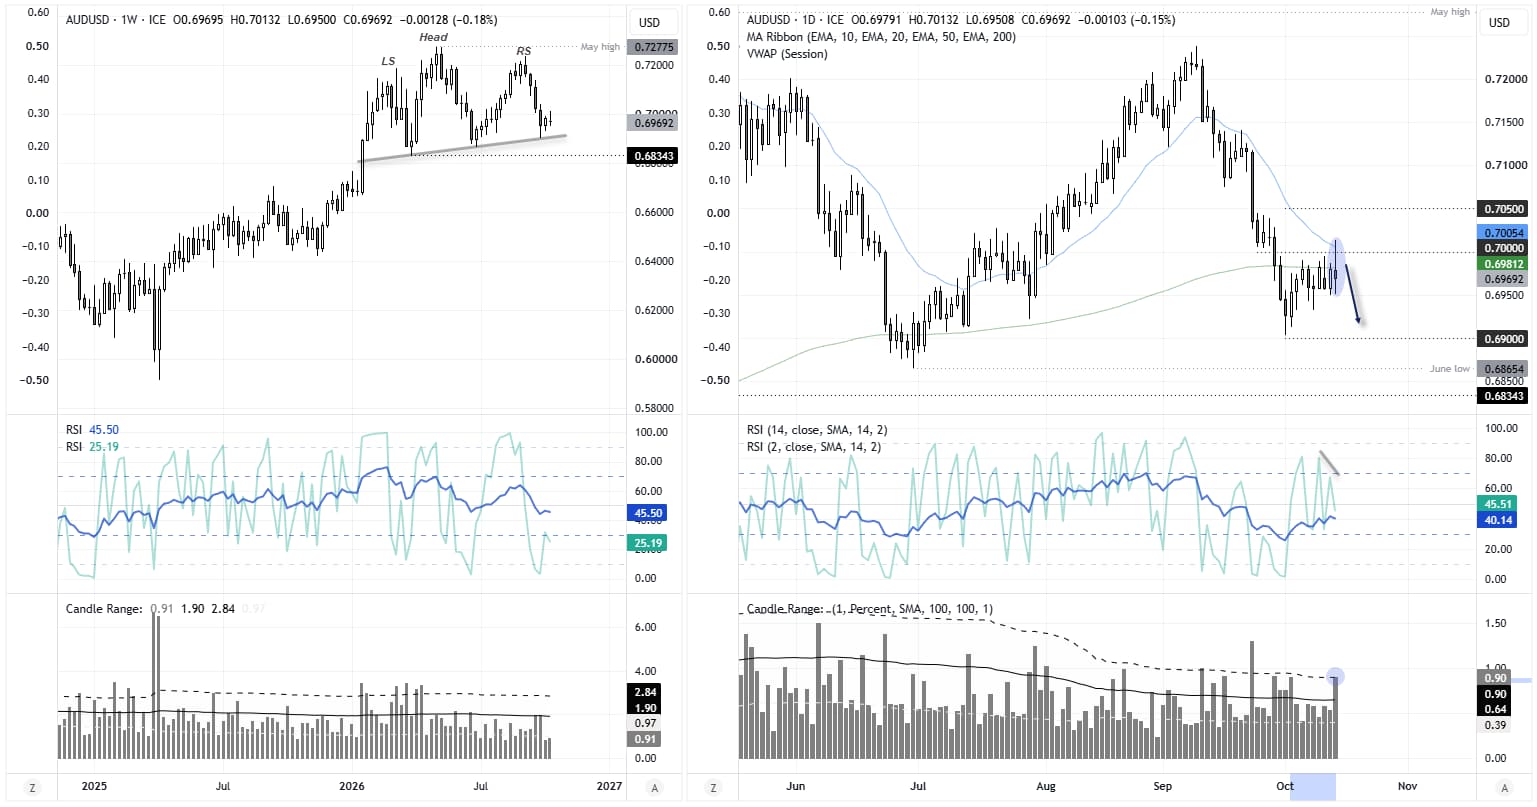
Source: ICE, TradingView
AUD/JPY Technical Analysis: Australian Dollar vs Japanese Yen
A similar setup may be emerging on AUD/JPY, though the daily chart doesn’t quite have the same bearish structure as AUD/USD. But the daily chart does also show an inverted hammer candle – with its most volatile daily range in seven.
The 200-day EMA is supporting for now, though a break of its also invalidates yesterday’s low for bears to assume bearish continuation.
A cluster of historical resistance levels including the 191 and 2024 highs make potential support levels over the near term, or intraday day targets for bears. But we need to see a clear break of the March and October low (108.78) before assuming bears have truly regained control. But if they do, the next major support level is the December VPOC near 106.52.
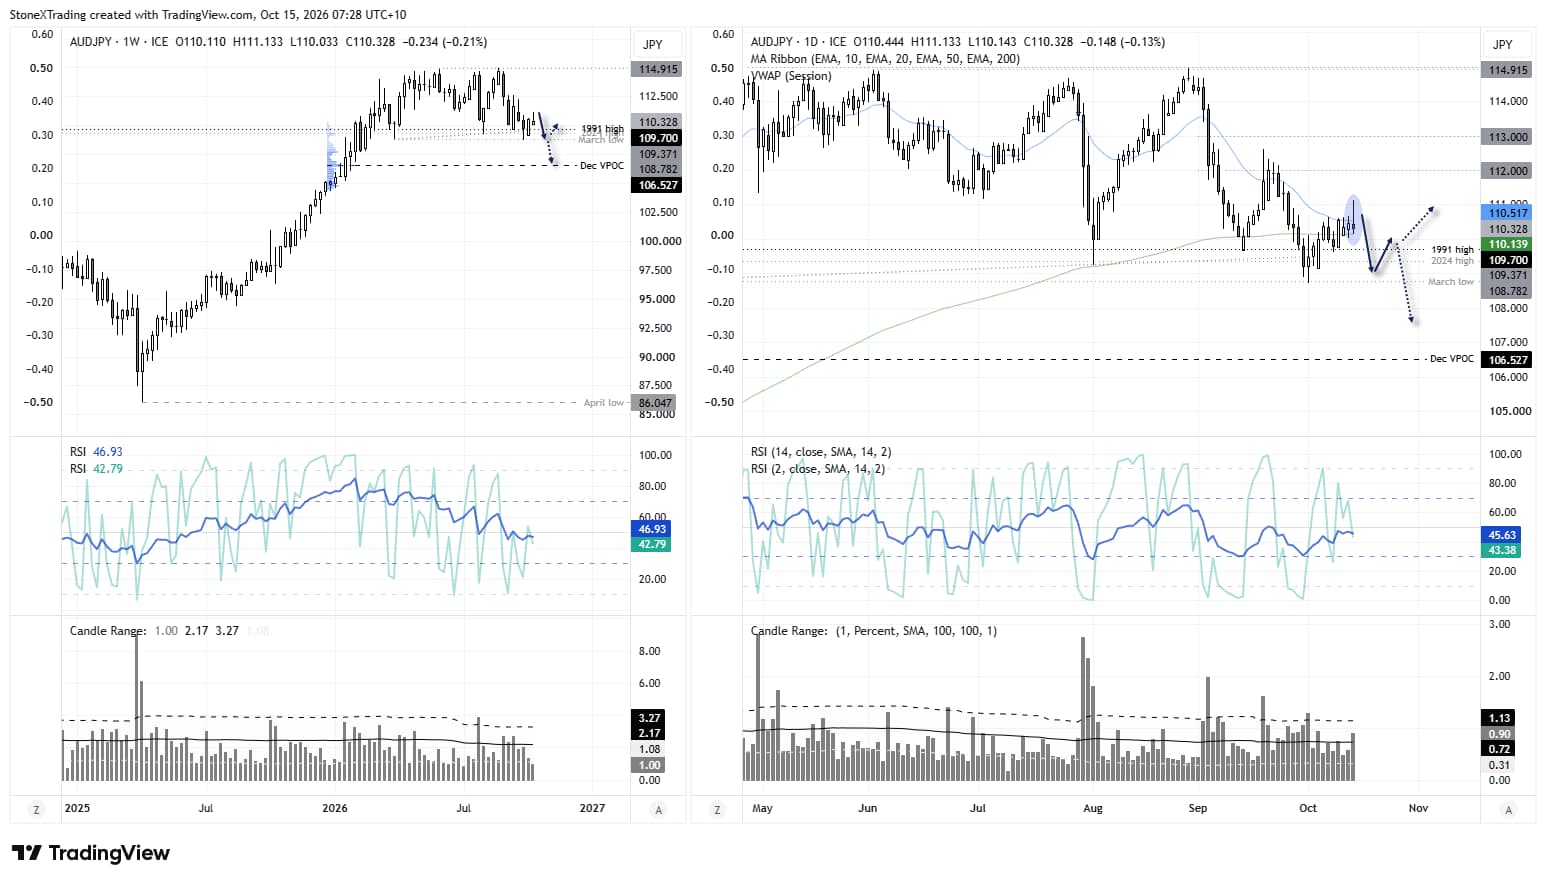
Source: ICE, TradingView

Australian Employment Report Could Pressure AUD/USD Bulls
Australia’s labour force report lands in a few hours. We know the RBA has retained a hawkish tone and that policymakers are concerned inflation may be more broad-based than simply high energy prices. This places CPI reports front and centre, though employment still matters to a degree.
Moreover, unemployment has been rising at a faster pace than the RBA’s own forecasts, so an unemployment rate of 4.7% or higher could cause further issues for Australian dollar bulls. And while job growth has been positive, part-time employment has been the main driver, while full-time employment has been slightly negative.
So the ideal scenario for AUD/USD bears is a rising unemployment rate alongside negative full-time job growth, with a contraction in headline employment being the cherry on top.