



CPI Preview: Is inflation close to peaking?
After a surge to 7% YoY for December, CPI is expected to have increase to 7.3% YoY in January.
Share this:

The US releases CPI on Thursday morning. After a surge to 7% YoY for December, CPI is expected to have increase to 7.3% YoY in January. In addition, the January Core CPI, which excludes food and energy, is expected to increase to 5.9% from 5.5% last. Remember that the Fed targets 2% inflation!
Indeed, this will be an important data print for the Fed. Recall that Fed Chairman Powell said during his press conference after the last FOMC meeting that in his view, inflation risks are still to the upside and that inflation could be higher for longer than expected. In addition, he noted that we are not making progress on the supply chain issue. He also said the “committee is of a mind to raise rates at the March meeting.” The main issue markets are focusing on now is : Will it be a 25bps hike or a 50bps hike? Markets are also wondering how soon the Fed will begin unwinding its bond holdings after the first hike. If the print is higher than expected, this may happen sooner than later.
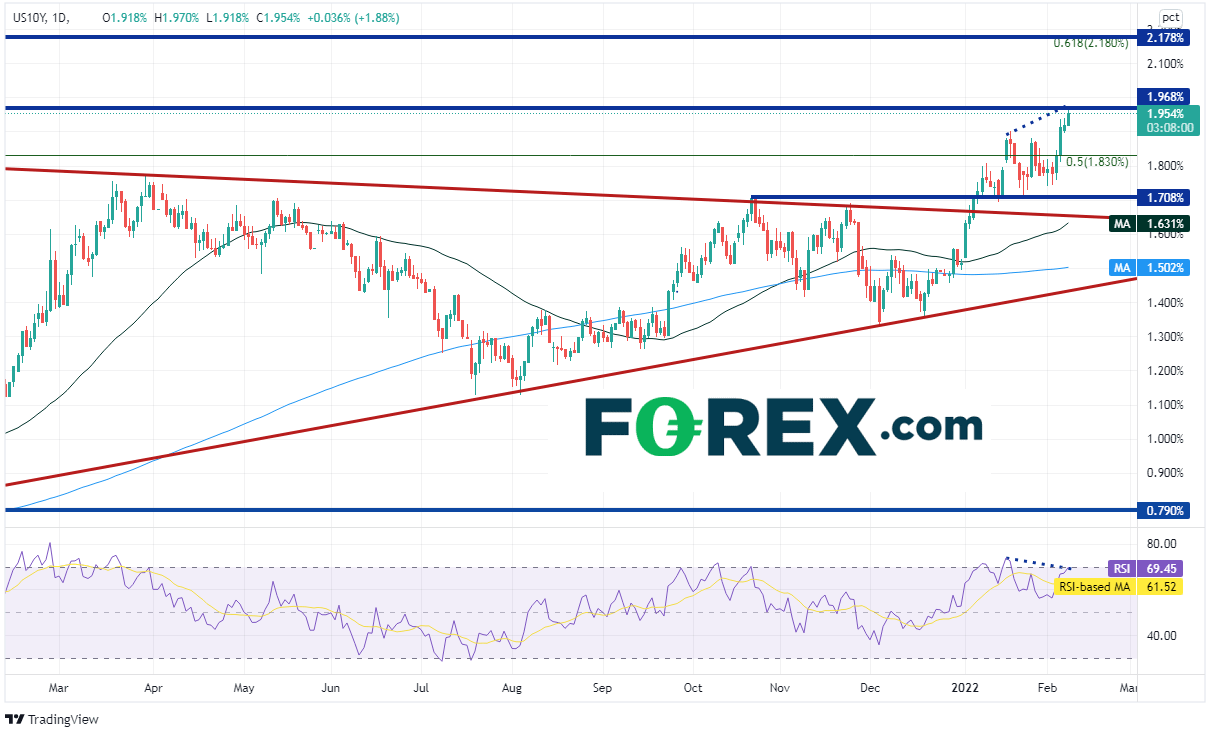
On concerns of rising interest rates, bond yields are moving higher. The benchmark 10-year yield traded as high as 1.97% on Tuesday, its highest level since July 2019 and just a few basis points below the psychological round number 2% level. Notice that the RSI is diverging from yields, a possible indication that they may pullback a bit before resuming the larger trend higher.
Source: Tradingview, Stone X
On a 240-minute timeframe, 10-year yields have been moving higher after breaking out of a pennant formation on February 3rd. The target for the pennant is the length of the pennant “pole” added to the breakout point. In this case the target is near 2.14%. However, for it to get there, yields must first pass through the psychological round number resistance level of 2% and then the 161.8% Fibonacci extension from the high of January 19th to the low on January 24th, near 2.023%. First support is at the high of January 19th near 1.902%. Below there is a confluence of support at the near the apex of the pennant between 1.743% and 1.80%, and then the January 19th low at 1.694%.

Source: Tradingview, Stone X
If inflation comes out as expected on Thursday at 7.3%, it will be the highest level since February 1982! However, traders will still be searching as to when the peak will be made for CPI. Will US yields continue higher? Or will the Fed start raising rates, possibly even by 50bps in March in order to stem the rise? Thursday’s CPI result may give traders a clue.
The US releases CPI on Thursday morning. After a surge to 7% YoY for December, CPI is expected to have increase to 7.3% YoY in January. In addition, the January Core CPI, which excludes food and energy, is expected to increase to 5.9% from 5.5% last. Remember that the Fed targets 2% inflation!
Indeed, this will be an important data print for the Fed. Recall that Fed Chairman Powell said during his press conference after the last FOMC meeting that in his view, inflation risks are still to the upside and that inflation could be higher for longer than expected. In addition, he noted that we are not making progress on the supply chain issue. He also said the “committee is of a mind to raise rates at the March meeting.” The main issue markets are focusing on now is : Will it be a 25bps hike or a 50bps hike? Markets are also wondering how soon the Fed will begin unwinding its bond holdings after the first hike. If the print is higher than expected, this may happen sooner than later.
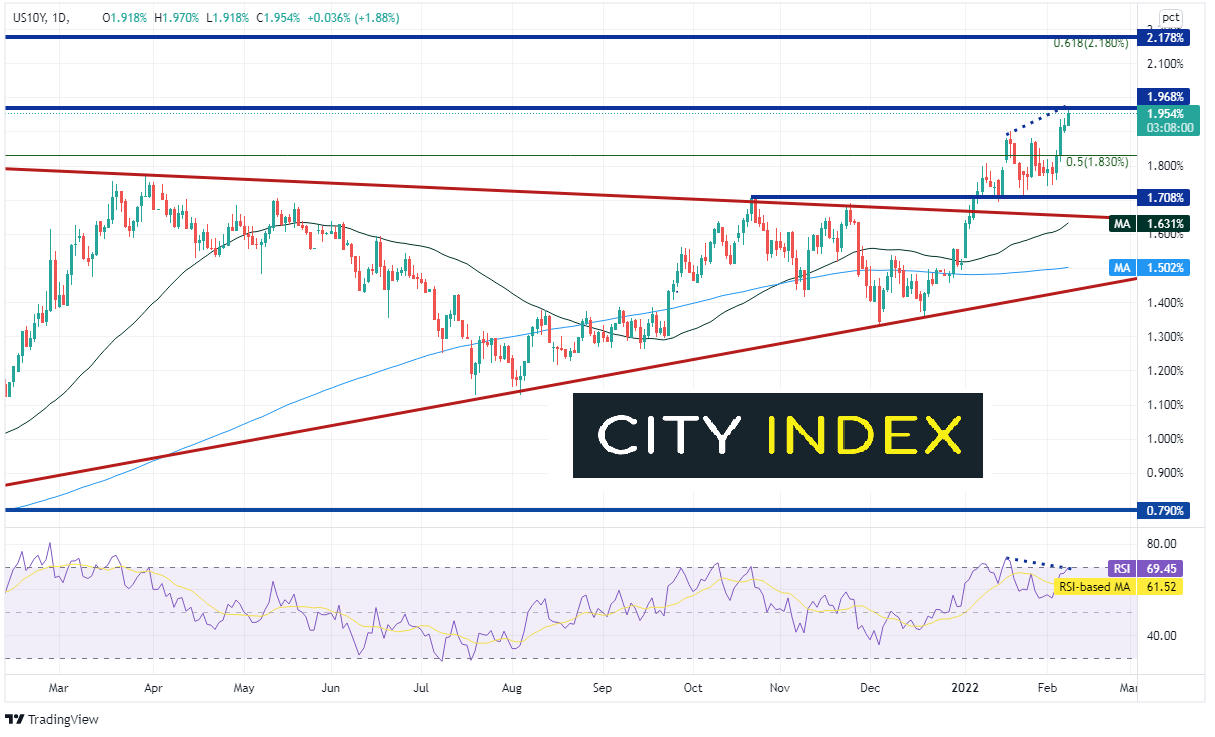
On concerns of rising interest rates, bond yields are moving higher. The benchmark 10-year yield traded as high as 1.97% on Tuesday, its highest level since July 2019 and just a few basis points below the psychological round number 2% level. Notice that the RSI is diverging from yields, a possible indication that they may pullback a bit before resuming the larger trend higher.
Source: Tradingview, Stone X
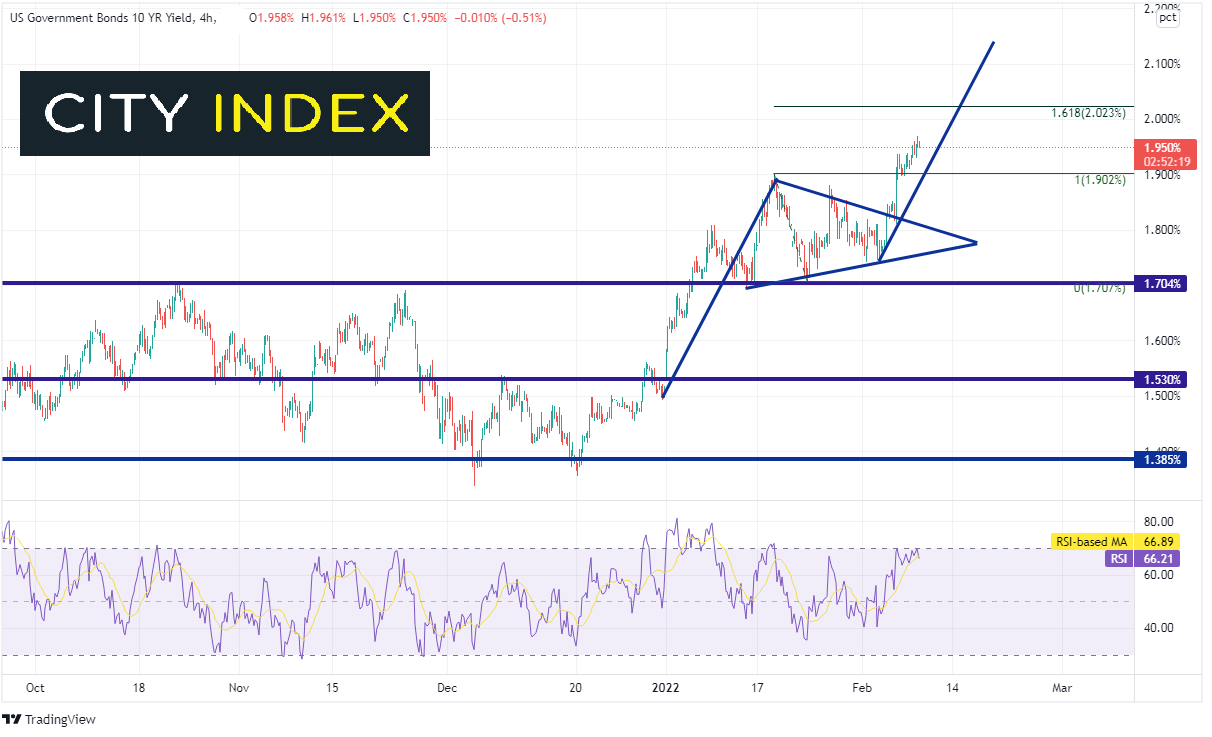
On a 240-minute timeframe, 10-year yields have been moving higher after breaking out of a pennant formation on February 3rd. The target for the pennant is the length of the pennant “pole” added to the breakout point. In this case the target is near 2.14%. However, for it to get there, yields must first pass through the psychological round number resistance level of 2% and then the 161.8% Fibonacci extension from the high of January 19th to the low on January 24th, near 2.023%. First support is at the high of January 19th near 1.902%. Below there is a confluence of support at the near the apex of the pennant between 1.743% and 1.80%, and then the January 19th low at 1.694%.
Source: Tradingview, Stone X
If inflation comes out as expected on Thursday at 7.3%, it will be the highest level since February 1982! However, traders will still be searching as to when the peak will be made for CPI. Will US yields continue higher? Or will the Fed start raising rates, possibly even by 50bps in March in order to stem the rise? Thursday’s CPI result may give traders a clue.
Latest market news




Open an account in minutes
Experience award-winning platforms with fast and secure execution.
Economic calendar
Web Trader platform
Our sophisticated web-based platform is packed with features.
Related articles
DXY, GBP/USD, AUD/USD, USD/CAD, USD/JPY, Gold Weekly Technical Outlook 11 16 2026
Sr. Technical Strategist Michael Boutros highlights the levels that matter on the USD Majors, commodities, and equity indices charts this week.
EUR/USD forecast: Dollar strength puts 1.1000 support in the spotlight | Currency Pair of the Week
The dollar extended its recent advance at the start of the week, with weakness across risk-sensitive assets reinforcing demand for the US currency. US equity futures slipped ahead of Nvidia’s earnings on Tuesday and an expected stock market debut by Anthropic later this week. Both events represent important tests for an AI trade that has become increasingly vulnerable to shifts in sentiment. In FX, EUR/USD nearly tested the psychologically important 1.1000 level, before bouncing modestly off its lows.


Forex & Gold Outlook: Dollar Dominates, Crosses Diverge
The US dollar rally gathers momentum as forex crosses develop contrasting technical setups. Matt Simpson examines eight FX markets and gold for potential trading opportunities.

StoneX Financial Ltd (trading as "FOREX.com") is an execution-only service provider. This material, whether or not it states any opinions, is for general information purposes only and it does not take into account your personal circumstances or objectives. This material has been prepared using the thoughts and opinions of the author and these may change. However, FOREX.com does not plan to provide further updates to any material once published and it is not under any obligation to keep this material up to date.
This material is short term in nature and may only relate to facts and circumstances existing at a specific time or day. Nothing in this material is (or should be considered to be) financial, investment, legal, tax or other advice and no reliance should be placed on it. No opinion given in this material constitutes a recommendation by FOREX.com or the author that any particular investment, security, transaction or investment strategy is suitable for any specific person.
The material has not been prepared in accordance with legal requirements designed to promote the independence of investment research. Although FOREX.com is not specifically prevented from dealing before providing this material, FOREX.com does not seek to take advantage of the material prior to its dissemination. This material is not intended for distribution to, or use by, any person in any country or jurisdiction where such distribution or use would be contrary to local law or regulation. For further details see our full non-independent research disclaimer and quarterly summary.