
EUR/USD Talking Points:
- EUR/USD bulls have shown seeming disinterest to pushing breakouts so far this week.
- But whether sellers can push down to a fresh low remains perhaps a bigger question following the Wednesday pivot last week.
- As of this writing, price is testing support at prior resistance, around the 1.1200 handle in the pair.
Worries continue to show in French government bonds and the volatility hasn’t yet quieted down in related markets. This has led to a stern sell-off in the single currency since early September, and more than six weeks later, there still hasn’t shown much for recovery.
Last week presented the potential for capitulation, just after the US CPI report. With stronger-than-expected US CPI, USD bulls (and EUR/USD bears) had every reason to push. And, at least initially, they did. But that didn’t last for long as a rally developed later in that session that led to a bullish engulf on Thursday. And perhaps even more interesting than just the technical observation is the environment in which that happened, as stronger-than-expected PPI wasn’t enough to deter the reversal.
That engulf led to continuation on Friday and last week closed as the first green week in six. And while that strength initially hung on through this week’s open, the rally has started to stumble, as bulls haven’t been able to force an encounter at the 1.1275-1.1285 area of resistance.
EUR/USD Daily Chart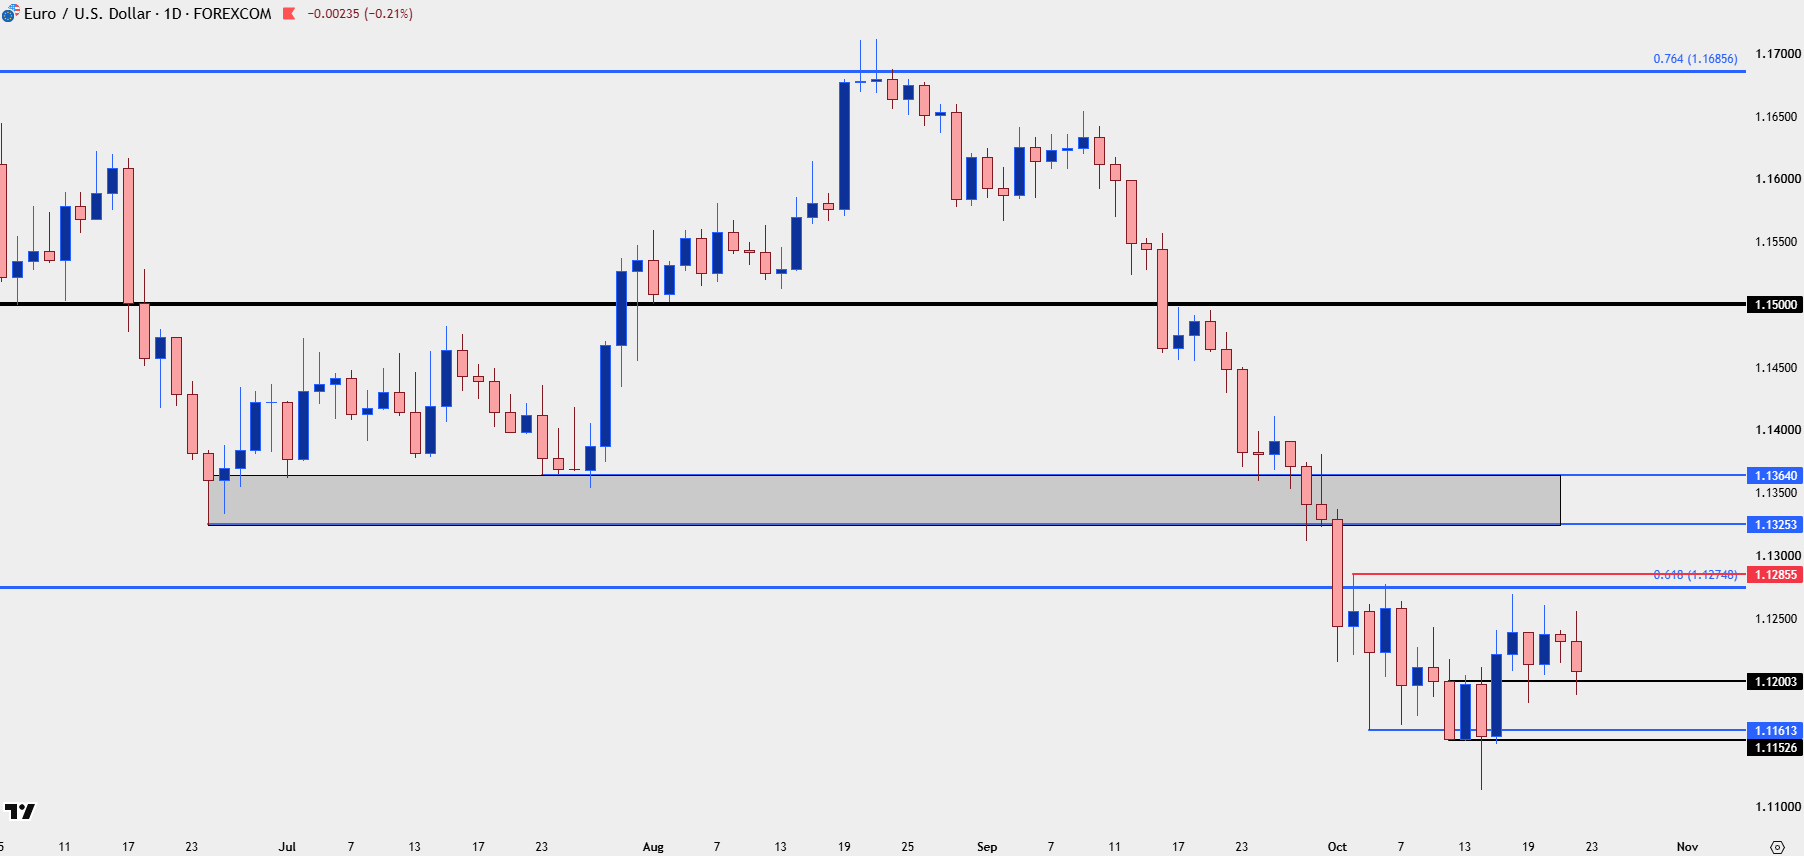
Chart prepared by James Stanley; data derived from Tradingview
EUR/USD The 1.1200 Handle
While buyers haven’t exactly taken control yet, sellers have been on their back foot since last week’s reversal, and from the four-hour chart, we can see a claim for a higher-low at familiar spot of 1.1200. That price has already held lows last Thursday and then again on Sunday and Monday after the weekly open, which illustrates consistent support at a higher-low, above last week’s swing.
But also on the four-hour chart below is an inverse head and shoulders pattern, with a neckline at that 1.1275-1.1285 spot on the chart. This further builds attraction for breakout potential, as a breach of that neckline would signal a larger shift, and the start of a possible bullish trend.
We’re not quite there yet, as all that we have witnessed at this point is stall from sellers. But, this can be the early ingredients to a reversal if bulls can take that next step.
EUR/USD Four-Hour Chart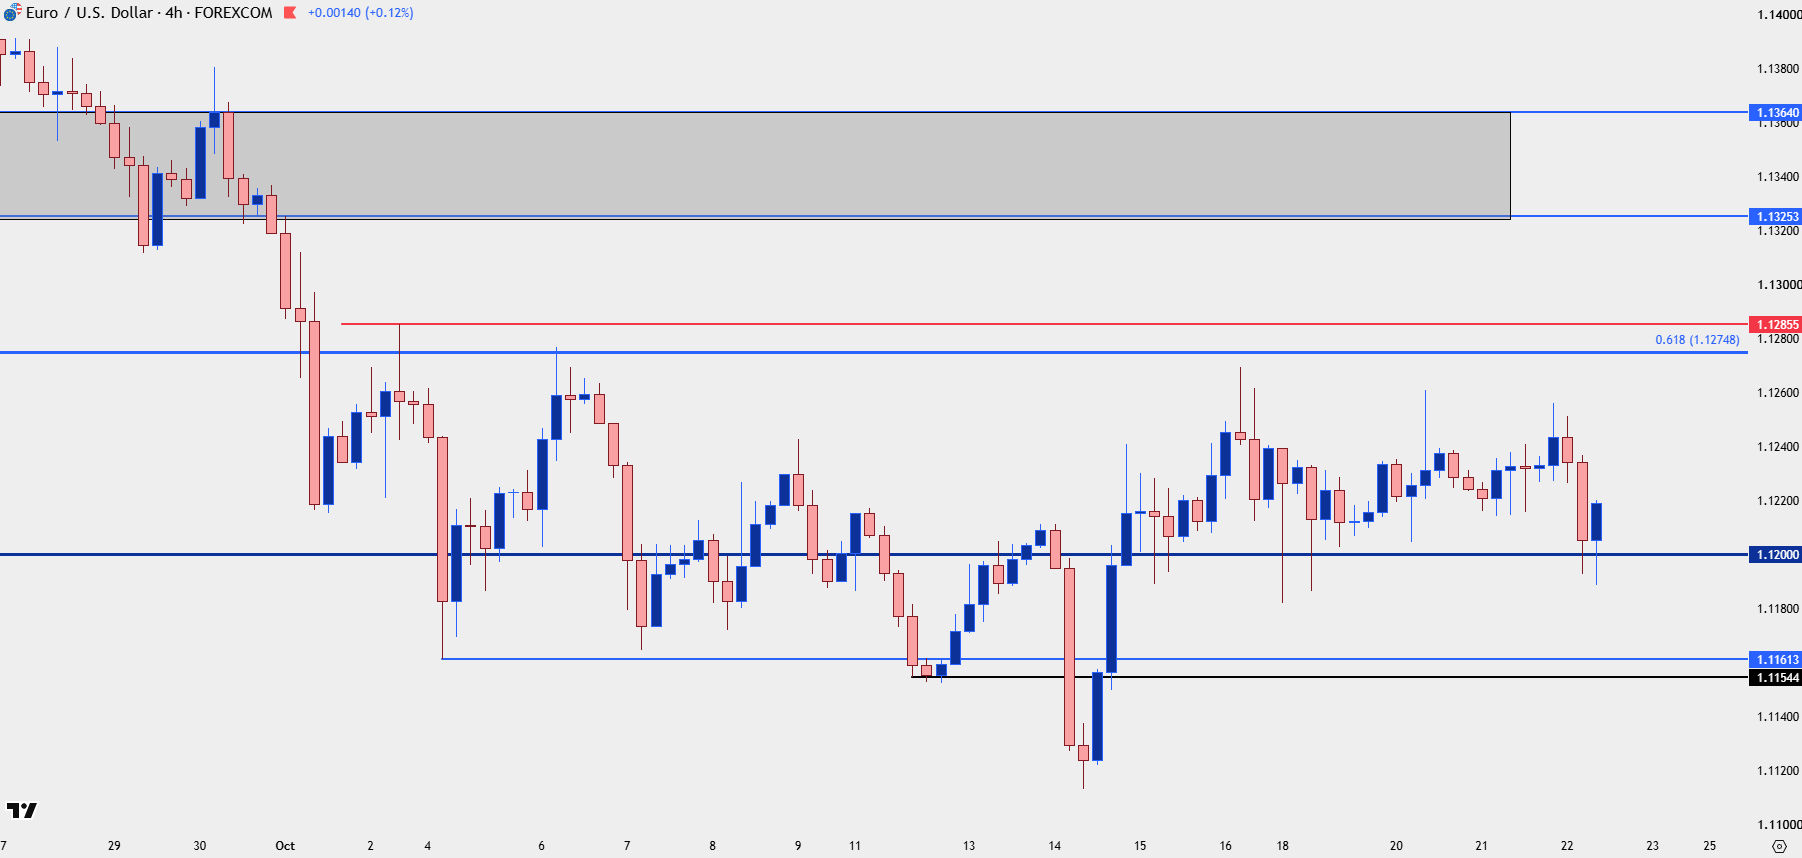
Chart prepared by James Stanley; data derived from Tradingview
--- written by James Stanley, Senior Market Analyst, Global Macro