





Stocks Doing what They Do Best Heading Higher
Not only is 2942 an important horizontal level, but it is also near the 61.8% Fibonacci level
Share this:

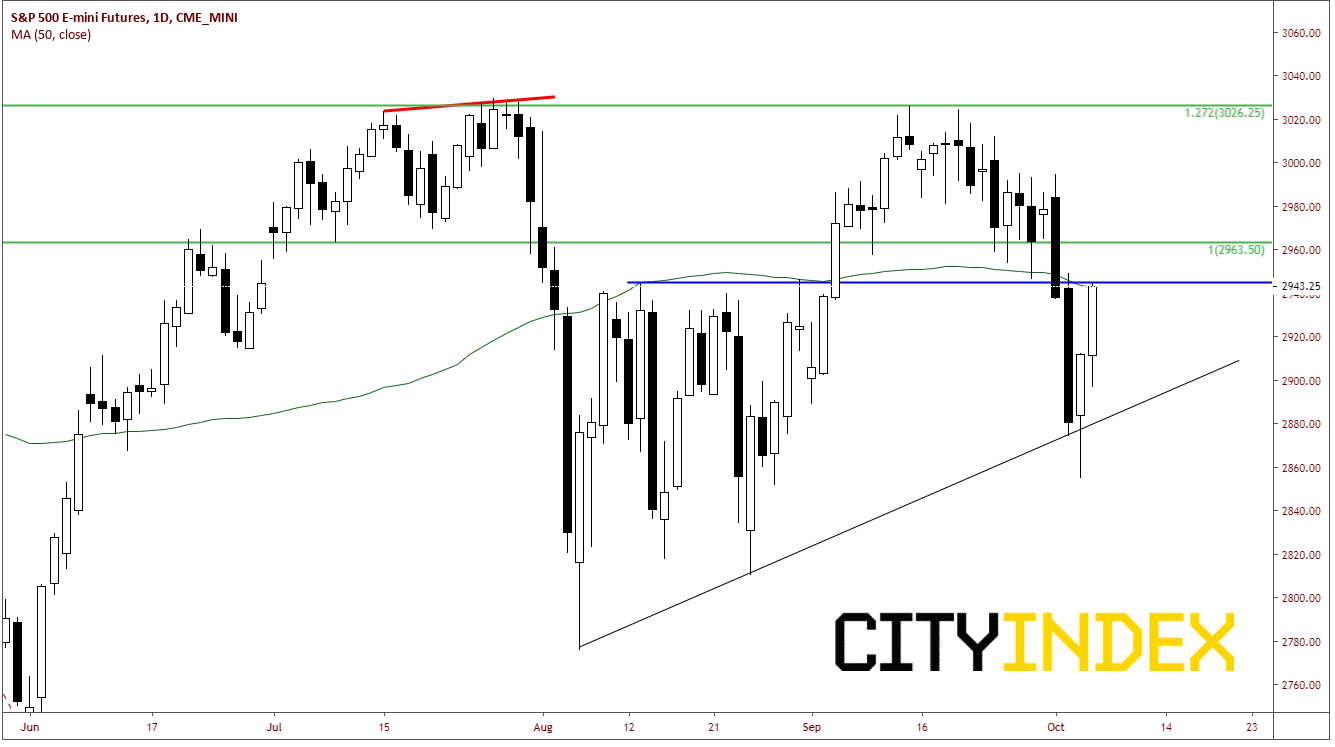
After days of disappointing data, S&P 500 Futures (S&Ps) were down nearly 4.5% over the last few days. However, after the benign Nonfarm payrolls were released today, S&Ps continued the rally which began yesterday afternoon, while most of the USD currency pairs remained in tight ranges. Stocks fell yesterday and tested the rising trendline, which dates back to August 6th yesterday, and failed to break though it. Once they failed to move lower below the trendline, price reversed and bounced back to the all-important 2942, which has been a pivotal point for stocks since early in August. It is also the 50 Day Moving Average.
Source: Tradingview, City Index, CME
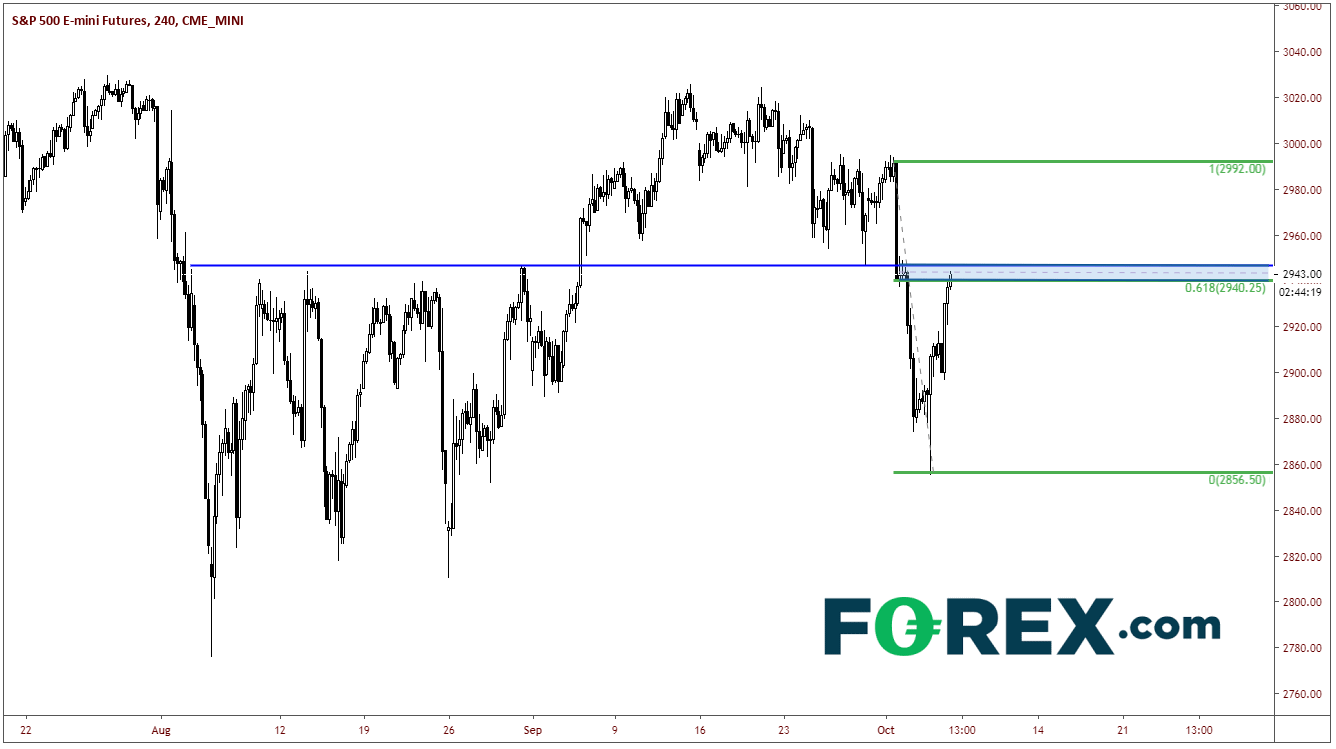
This afternoon, Fed Chairman Powell came out with comments noting that it’s the “Fed’s job to keep the economy expanding as long as possible.” Stocks took this as a signal that the FOMC is cutting at the end of the month and continued the charge higher. On a 240-minute chart, one can see that not only is 2942 an important horizontal level, but it is also near the 61.8% Fibonacci level from the highs before the ISM Manufacturing data to yesterday’s lows! If the S&P500 manages to break through this area of resistance, the index can be up to the downward sloping trending near 2980 very quickly. Above that is the pre-ISM data level at 2992. Support doesn’t come in until yesterday’s highs at 2912.50.
Source: Tradingview, City Index, CME
Towards the end of next week, China is set to come to Washington to discuss trade. Although there is data and Brexit talk that will be out before then, these talks can be a game changer for stocks (not to mention the US Dollar). If a deal is reached, stocks could test the highs near 3050. If no deal is reached and there is nothing in sight, they can be testing last year’s lows again under 2500.
Also, remain on high alert over the weekend for headlines and tweets surrounding the Impeachment Inquiry.
(As of the time of publishing, S&P 500 Futures are trading 2950, trying to squeeze every last short out of this market!!)
After days of disappointing data, S&P 500 Futures (S&Ps) were down nearly 4.5% over the last few days. However, after the benign Nonfarm payrolls were released today, S&Ps continued the rally which began yesterday afternoon, while most of the USD currency pairs remained in tight ranges. Stocks fell yesterday and tested the rising trendline, which dates back to August 6th yesterday, and failed to break though it. Once they failed to move lower below the trendline, price reversed and bounced back to the all-important 2942, which has been a pivotal point for stocks since early in August. It is also the 50 Day Moving Average.
Source: Tradingview, Forex.com, CME
This afternoon, Fed Chairman Powell came out with comments noting that it’s the “Fed’s job to keep the economy expanding as long as possible.” Stocks took this as a signal that the FOMC is cutting at the end of the month and continued the charge higher. On a 240-minute chart, one can see that not only is 2942 an important horizontal level, but it is also near the 61.8% Fibonacci level from the highs before the ISM Manufacturing data to yesterday’s lows! If the S&P500 manages to break through this area of resistance, the index can be up to the downward sloping trending near 2980 very quickly. Above that is the pre-ISM data level at 2992. Support doesn’t come in until yesterday’s highs at 2912.50.
Source: Tradingview, Forex.com, CME
Towards the end of next week, China is set to come to Washington to discuss trade. Although there is data and Brexit talk that will be out before then, these talks can be a game changer for stocks (not to mention the US Dollar). If a deal is reached, stocks could test the highs near 3050. If no deal is reached and there is nothing in sight, they can be testing last year’s lows again under 2500.
Also, remain on high alert over the weekend for headlines and tweets surrounding the Impeachment Inquiry.
(As of the time of publishing, S&P 500 Futures are trading 2950, trying to squeeze every last short out of this market!!)
Related tags:
Latest market news




Open an account in minutes
Experience award-winning platforms with fast and secure execution.
Economic calendar
Web Trader platform
Our sophisticated web-based platform is packed with features.
Related articles

USD/JPY, USD/CAD Outlook: Fed hawks put dollar bulls on alert
Hotter US inflation and hawkish Fed commentary have triggered a sharp repricing of interest rate expectations. USD/JPY and USD/CAD are in focus as the dollar's sensitivity to Fed policy strengthens.


US CPI Preview: Will Inflation Fall Enough to Put a Fed Hike in Doubt?
A CPI reading that comes in above, or even at, consensus expectations this month would keep the FOMC on track to hike, so only a notable downside surprise would be likely to drive significant market volatility - what does that mean for the US Dollar?


EUR/USD Forecast: Euro Under Pressure After Strong NFP Data
As the trading week comes to an end, the euro has once again struggled to sustain a meaningful recovery against the U.S. dollar, highlighting renewed weakness within EUR/USD price action. During the final trading session of the week, the pair declined nearly 0.7%, reflecting that confidence around the European currency remains limited in the short term.

StoneX Financial Ltd (trading as "FOREX.com") is an execution-only service provider. This material, whether or not it states any opinions, is for general information purposes only and it does not take into account your personal circumstances or objectives. This material has been prepared using the thoughts and opinions of the author and these may change. However, FOREX.com does not plan to provide further updates to any material once published and it is not under any obligation to keep this material up to date.
This material is short term in nature and may only relate to facts and circumstances existing at a specific time or day. Nothing in this material is (or should be considered to be) financial, investment, legal, tax or other advice and no reliance should be placed on it. No opinion given in this material constitutes a recommendation by FOREX.com or the author that any particular investment, security, transaction or investment strategy is suitable for any specific person.
The material has not been prepared in accordance with legal requirements designed to promote the independence of investment research. Although FOREX.com is not specifically prevented from dealing before providing this material, FOREX.com does not seek to take advantage of the material prior to its dissemination. This material is not intended for distribution to, or use by, any person in any country or jurisdiction where such distribution or use would be contrary to local law or regulation. For further details see our full non-independent research disclaimer and quarterly summary.