



Two trades to watch: EUR/USD, NASDAQ
EURUSD falls ahead of PMIs. Nasdaq rises cautiously ahead of the NATO meeting.
Share this:

EURUSD falls ahead of PMIs
EURUSD is falling for a second straight day.
EUR fell yesterday amid fears over Europe’s fuel security after Putin demanded payment for gas in Rubles and after EZ consumer confidence tumbled to its lowest level since May 2020.
Meanwhile, the USD, rose as more Fed speakers spoke of the need to hike rates more aggressively.
Today European and US PMI data is due to be released and are expected to show that growth slowed in March but remains above 50, separating expansion from contraction.
EZ Composite PMI is expected to fall to 54, down from 55.5.
President Biden is in Brussels for a series of talks on the Ukraine crisis, which could mean more sanctions are coming. Headlines from here could drive risk sentiment and potentially pull on the EUR.
Where next for EUR/USD?
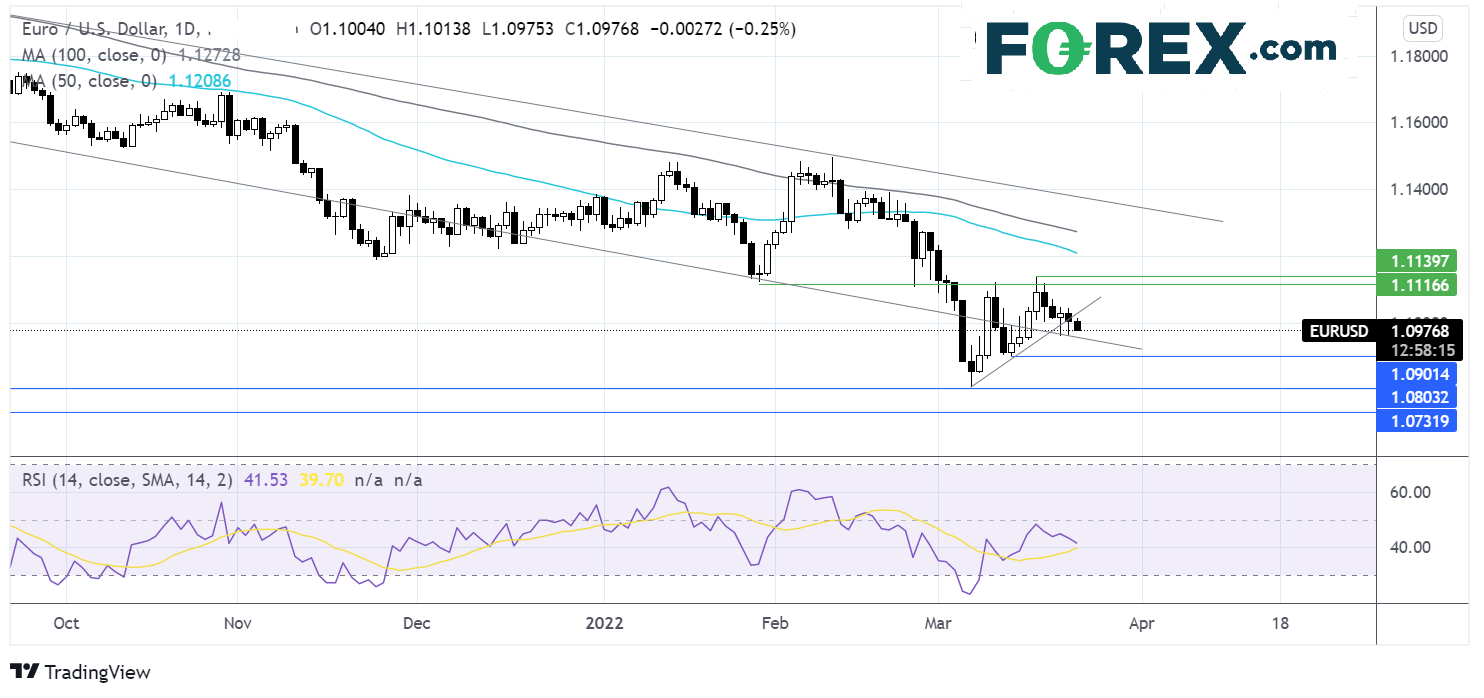
EUR/USD rebounded from the 2022 low of 1.08, re-entering the multi-month falling channel, and ran into resistance at1.1140. The price has eased lower from 1.1140, falling below the 2-week rising trendline, and the RSI suggests more downside to come.
Support can be seen at 1.0955, the lower band of the multi-month falling channel with a break below here, opening the door to 1.09, the March 14 low ahead of 1.08, the 2022 low.
On the flip side, buyers will look to move above 1.10 psychological level, and 1.1045 the rising trendline resistance. But it would take a move over 1.1120/40 zone for buyers to change the bias to bullish.

Nasdaq rises cautiously ahead of NATO meeting more Fed speak
After steep losses in the previous session, the US tech-heavy index is rising today as risk sentiment cautiously improves.
Yesterday oil prices rose to $120, fuelling fears of high inflation and a squeeze on business margins and household incomes.
Fed speakers continued expressing the need to hike rates more aggressively to tame inflation. More Fed speakers are due to hit the airwaves today.
Today US Biden’s NATO meeting is likely to drive sentiment. More sanctions could drag risk sentiment lower.
US services PMI is expected to fall to 56 from 56.5, manufacturing is expected to slip to 55.8 from 57.3.
US durable goods are expected to fall -0.5% MoM in February after rising 1.6% in January. Jobless claims are expected to fall to 211k.
Where next for NASDAQ?
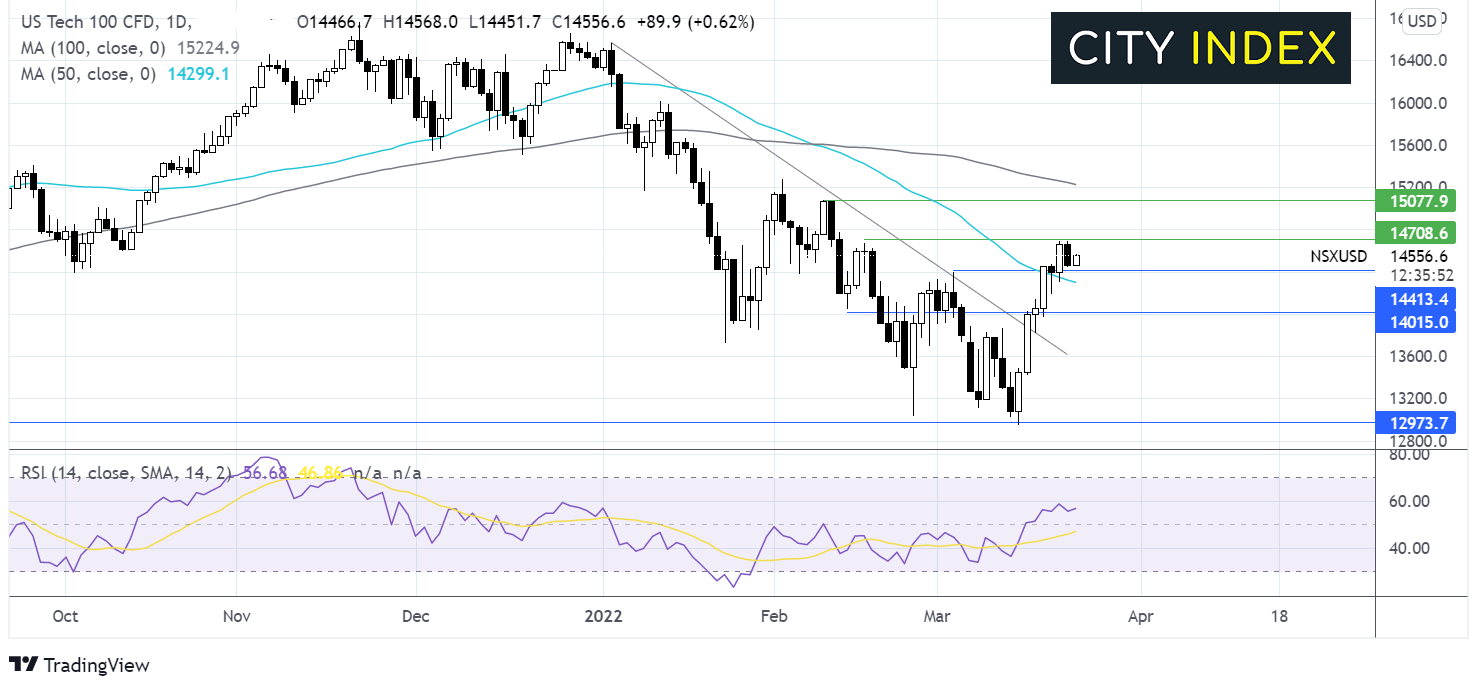
The Nasdaq has extended its rebound from 12975 the 2022 low, pushing over the 50 sma before running into resistance at 14700, the weekly high.
The RSI suggests that there is more upside to be had. However, buyers will need to break over 14700 to 15000 round number and Februar 9 high, before exposing the 100 sna at 15235.
On the downside, support can be seen at 14400, the March 3 high, with a break below here exposing the 50 sna at 14300 and then 14000 round number.

How to trade with City Index
Follow these easy steps to start trading with City Index today:
- Open a City Index account, or log-in if you’re already a customer.
- Search for the market you want to trade in our award-winning platform.
- Choose your position and size, and your stop and limit levels
- Place the trade.
Related tags:
Latest market news




Open an account in minutes
Experience award-winning platforms with fast and secure execution.
Economic calendar
Web Trader platform
Our sophisticated web-based platform is packed with features.
Related articles
NZD/USD Forecast: Kiwi faces historic breakdown as RBNZ survey looms
NZD/USD is teetering above support that held through the pandemic and Liberation Day turmoil. With RBNZ hawks repeatedly disappointed, today's inflation expectations survey could open the door to a slide towards the GFC lows.
USD/JPY, AUD/JPY: Central Bank Divergence Creates Two-Way Risk
USD/JPY eyes a breakout above 160, while AUD/JPY faces further losses as Fed, RBA and BoJ interest rate expectations diverge.

DXY, GBP/USD, AUD/USD, USD/CAD, USD/JPY, Gold Weekly Technical Outlook 11 16 2026
Sr. Technical Strategist Michael Boutros highlights the levels that matter on the USD Majors, commodities, and equity indices charts this week.

StoneX Financial Ltd (trading as "FOREX.com") is an execution-only service provider. This material, whether or not it states any opinions, is for general information purposes only and it does not take into account your personal circumstances or objectives. This material has been prepared using the thoughts and opinions of the author and these may change. However, FOREX.com does not plan to provide further updates to any material once published and it is not under any obligation to keep this material up to date.
This material is short term in nature and may only relate to facts and circumstances existing at a specific time or day. Nothing in this material is (or should be considered to be) financial, investment, legal, tax or other advice and no reliance should be placed on it. No opinion given in this material constitutes a recommendation by FOREX.com or the author that any particular investment, security, transaction or investment strategy is suitable for any specific person.
The material has not been prepared in accordance with legal requirements designed to promote the independence of investment research. Although FOREX.com is not specifically prevented from dealing before providing this material, FOREX.com does not seek to take advantage of the material prior to its dissemination. This material is not intended for distribution to, or use by, any person in any country or jurisdiction where such distribution or use would be contrary to local law or regulation. For further details see our full non-independent research disclaimer and quarterly summary.