



US Dollar Price Action Setups: EUR/USD, GBP/USD, USD/JPY, USD/CAD
The US Dollar finished last week with a bearish engulf following a four-week winning streak. But the big question now is whether the Euro can pose any form of a recovery.
Share this:

US Dollar Talking Points:
- The US Dollar finished last week with a bearish engulfing candlestick. So far this week, the weakness has continued with sellers pushing below the 101.80 Fibonacci level.
- EUR/USD remains a big part of this and while the pair didn’t quite put in a bullish engulf last week, there is prospect of capitulation given the way the daily chart has set up.
- GBP/USD remains more attractive for bearish USD themes, while USD/JPY is more attractive for bullish scenarios. USD/CAD may soon be in that bullish USD camp, as well.
The topic for this week’s webinar is topography matters, speaking to the value of longer-term charts for directional impulse, even for traders executing shorter-term strategies.
In the USD, it’s been a strong trend for the prior four weeks, driven by a FOMC rate hike and a more-hawkish Fed. But a big part of that has been continued sell-off in the Euro despite deep oversold conditions, and that remains a big piece of the puzzle for both USD/DXY and EUR/USD in the days and weeks ahead.
US Dollar Weekly Chart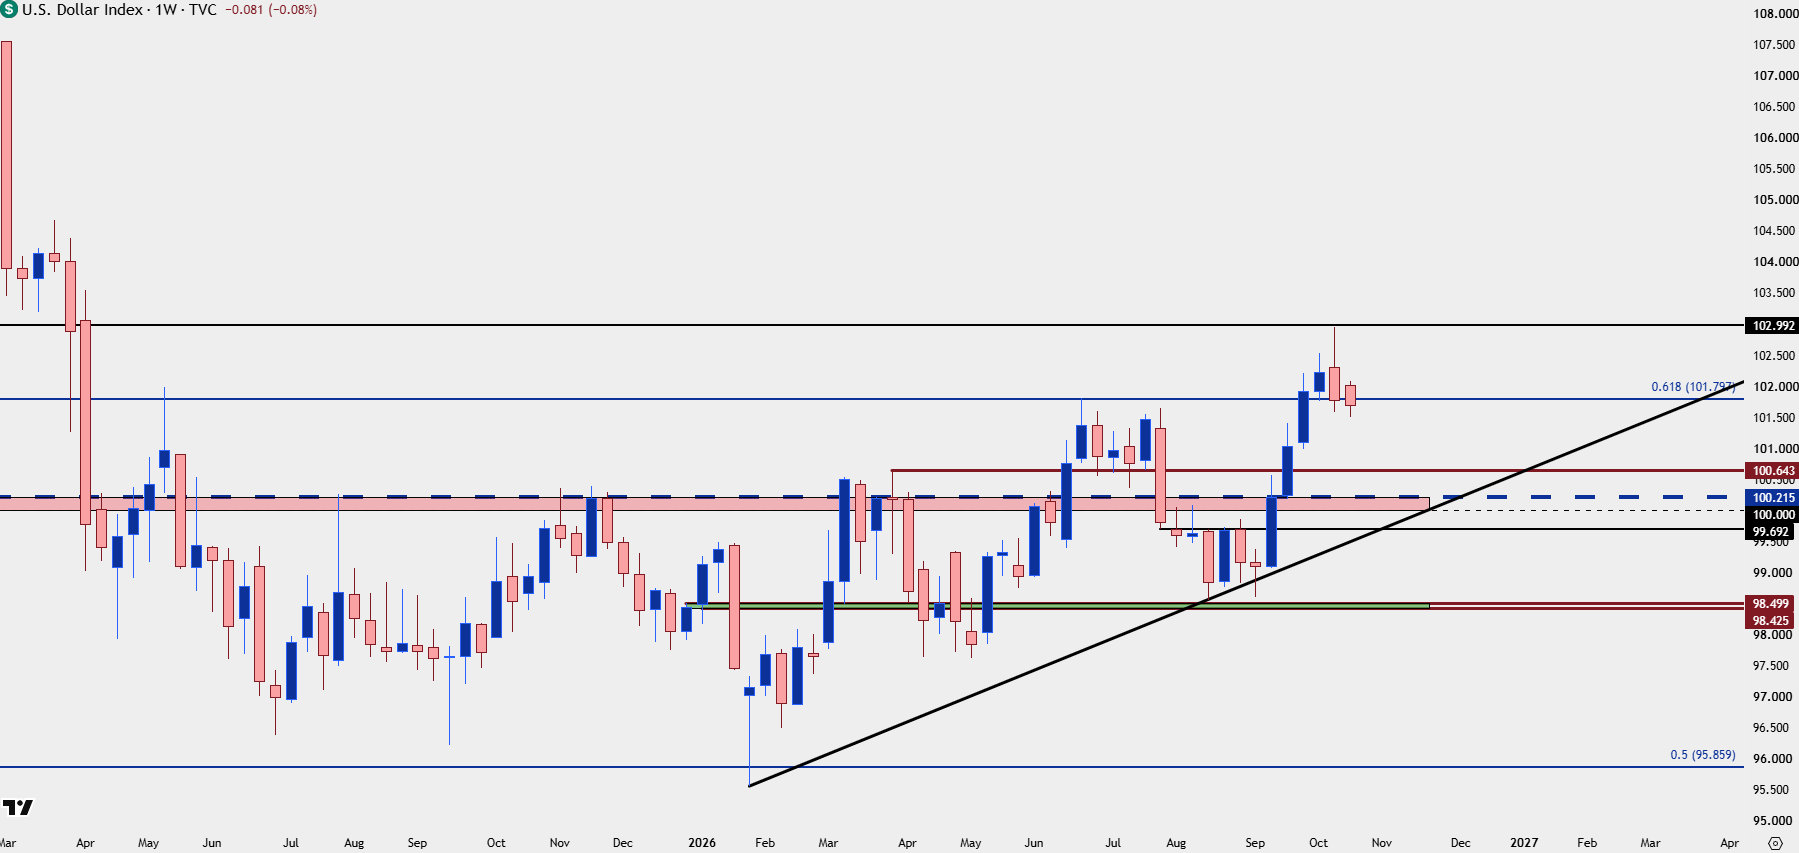
Chart prepared by James Stanley; data derived from Tradingview
EUR/USD
In last week’s webinar, the topic was ‘capitulation’ along with ‘two ways to trade a turn.’ A day after that session we may have seen that in EUR/USD, helped along by a strong US CPI print.
Sellers initially pushed for a fresh yearly low, but they didn’t get very far, and a rally by the end of the day exposed a wide underside wick. The next day, a strong PPI report out of the US was unable to continue that sell-off and, instead, bulls pushed up for a fresh higher-high, which continued through Friday trade.
A pullback showed up to open this week but, so far, buyers have held up support at prior resistance, around the 1.1212 Fibonacci level, and that keeps the door open for bulls to push for a greater recovery and that speaks to the short side of the Dollar looked at above. For next levels, it’s the 1.1265-1.1285 zone sitting overhead that buyers need to push through to exhibit greater control of the matter.
EUR/USD Daily Chart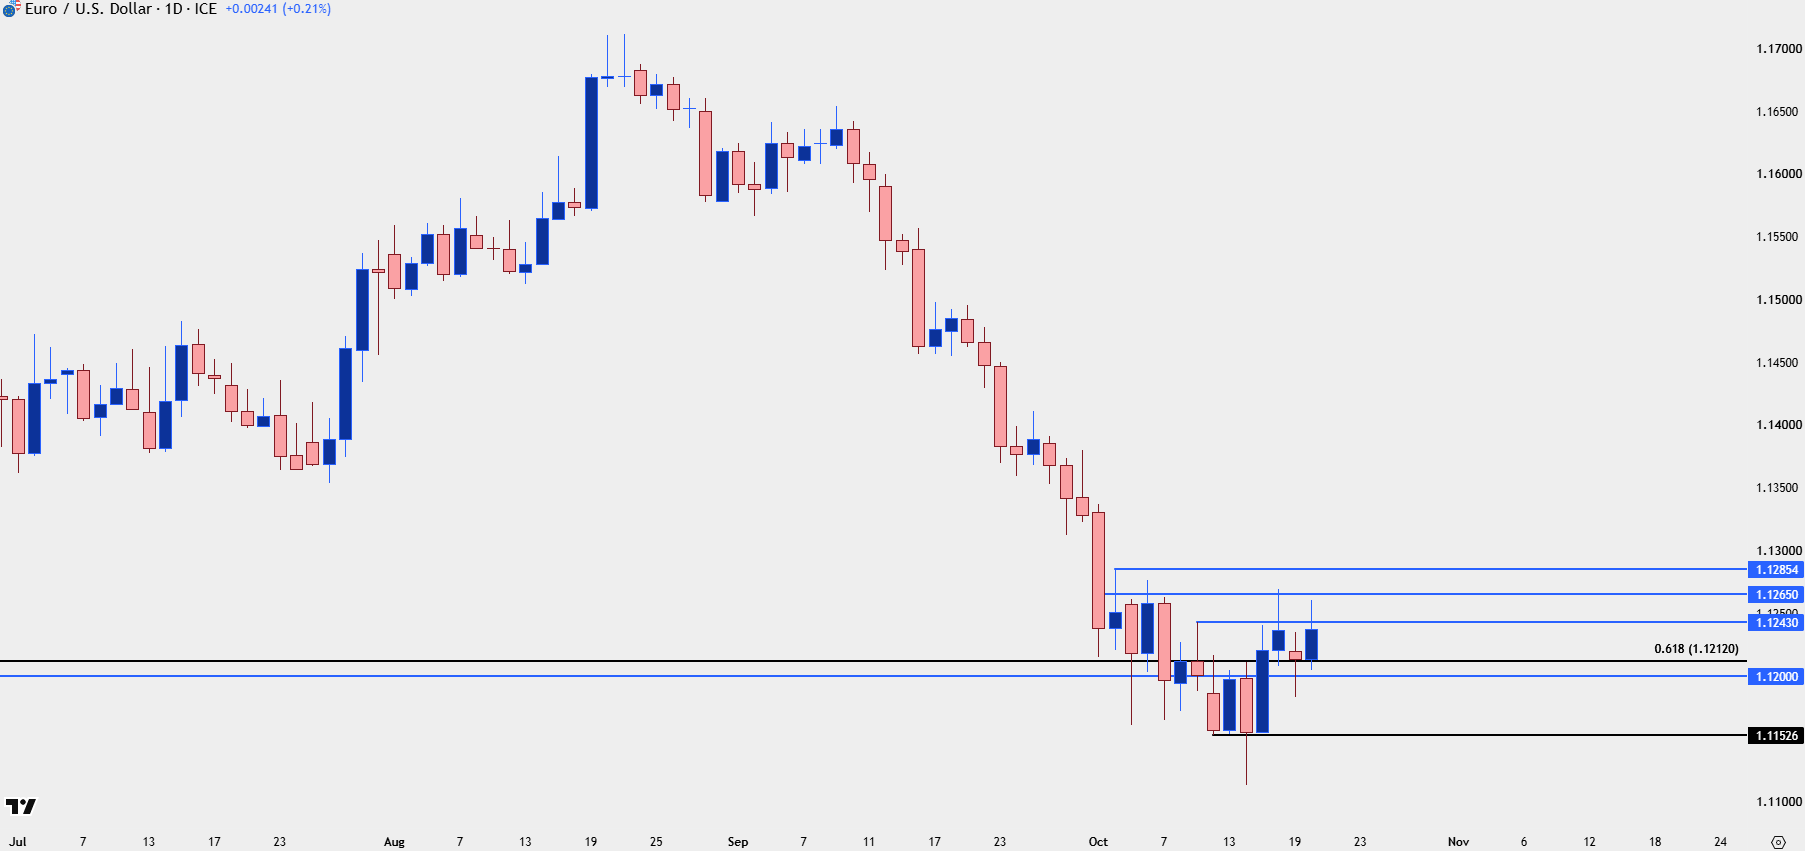
Chart prepared by James Stanley; data derived from Tradingview
GBP/USD
For USD-weakness I still prefer GBP/USD. The pair put in a strong reversal from a big support level last week and in the webinar, I compared the weekly bar here against EUR/USD to illustrate why Cable is still deserving of that attention.
At this point, resistance is showing at the 23.6% retracement of the same Fibonacci setup from which last week’s support bounced from the 38.2% marker, and in the webinar, I highlighted two support zones to work with for pullback scenarios in the pair.
GBP/USD Daily Price Chart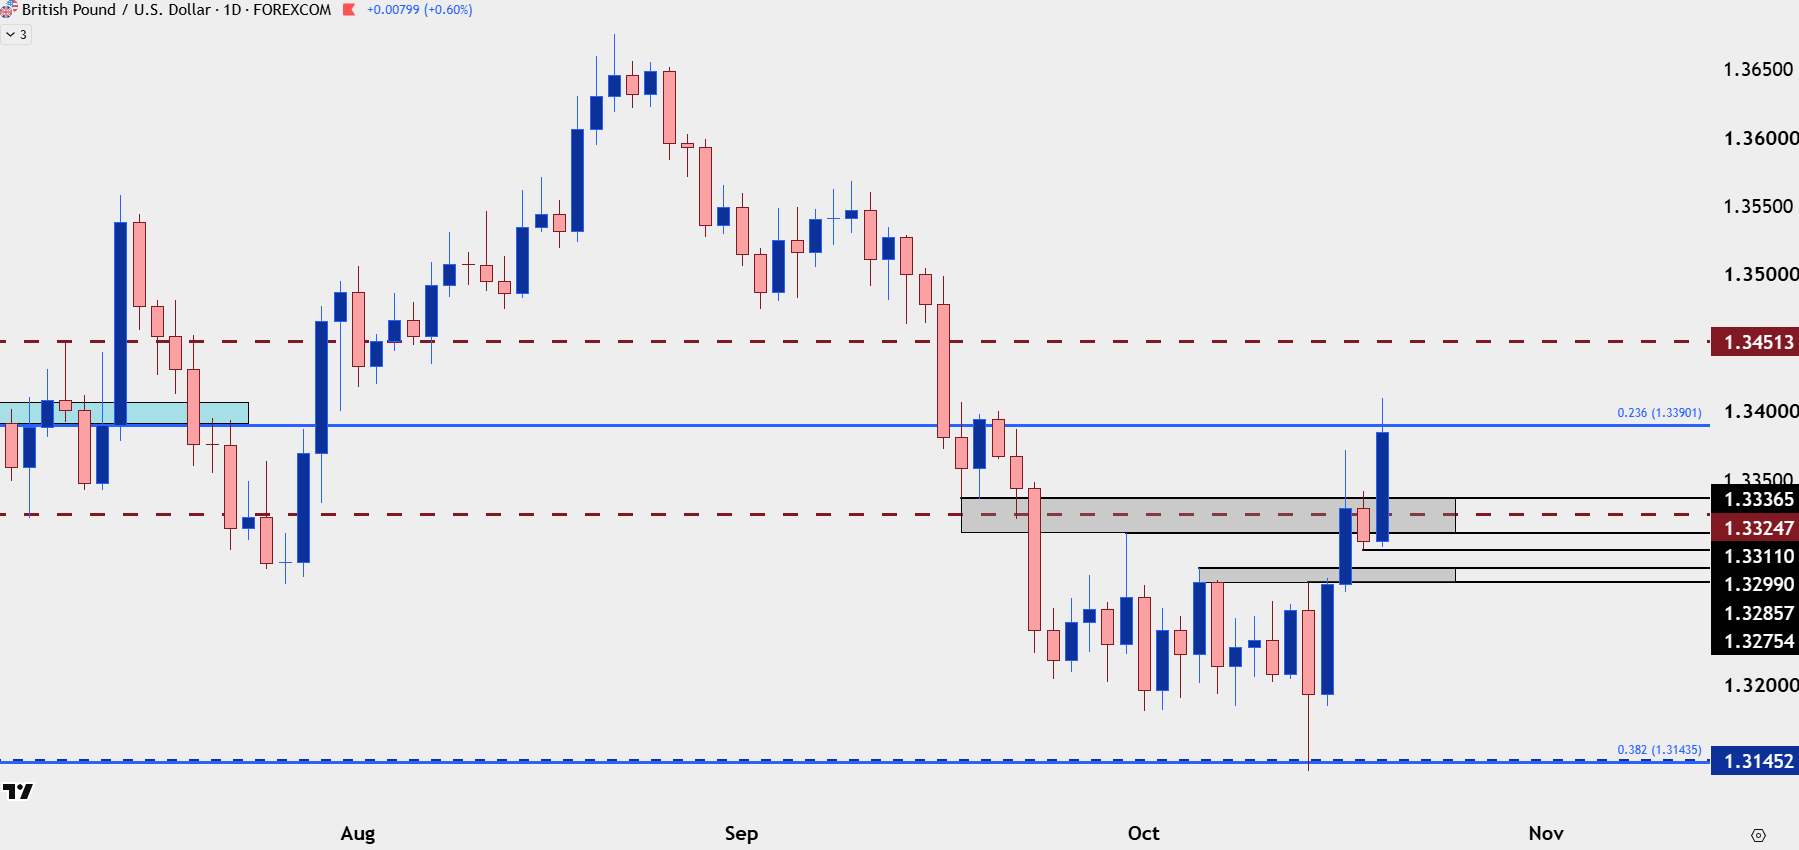
Chart prepared by James Stanley; data derived from Tradingview
USD/JPY
For USD-strength, I still prefer USD/JPY, with the caveat that I think there’s theoretically capped upside as a push above 160 will probably elicit intervention comments and that may even be true for a poke above 159.00. I talked about this in greater depth yesterday, asking whether the 160.00 level is vulnerable.
USD/JPY Daily Chart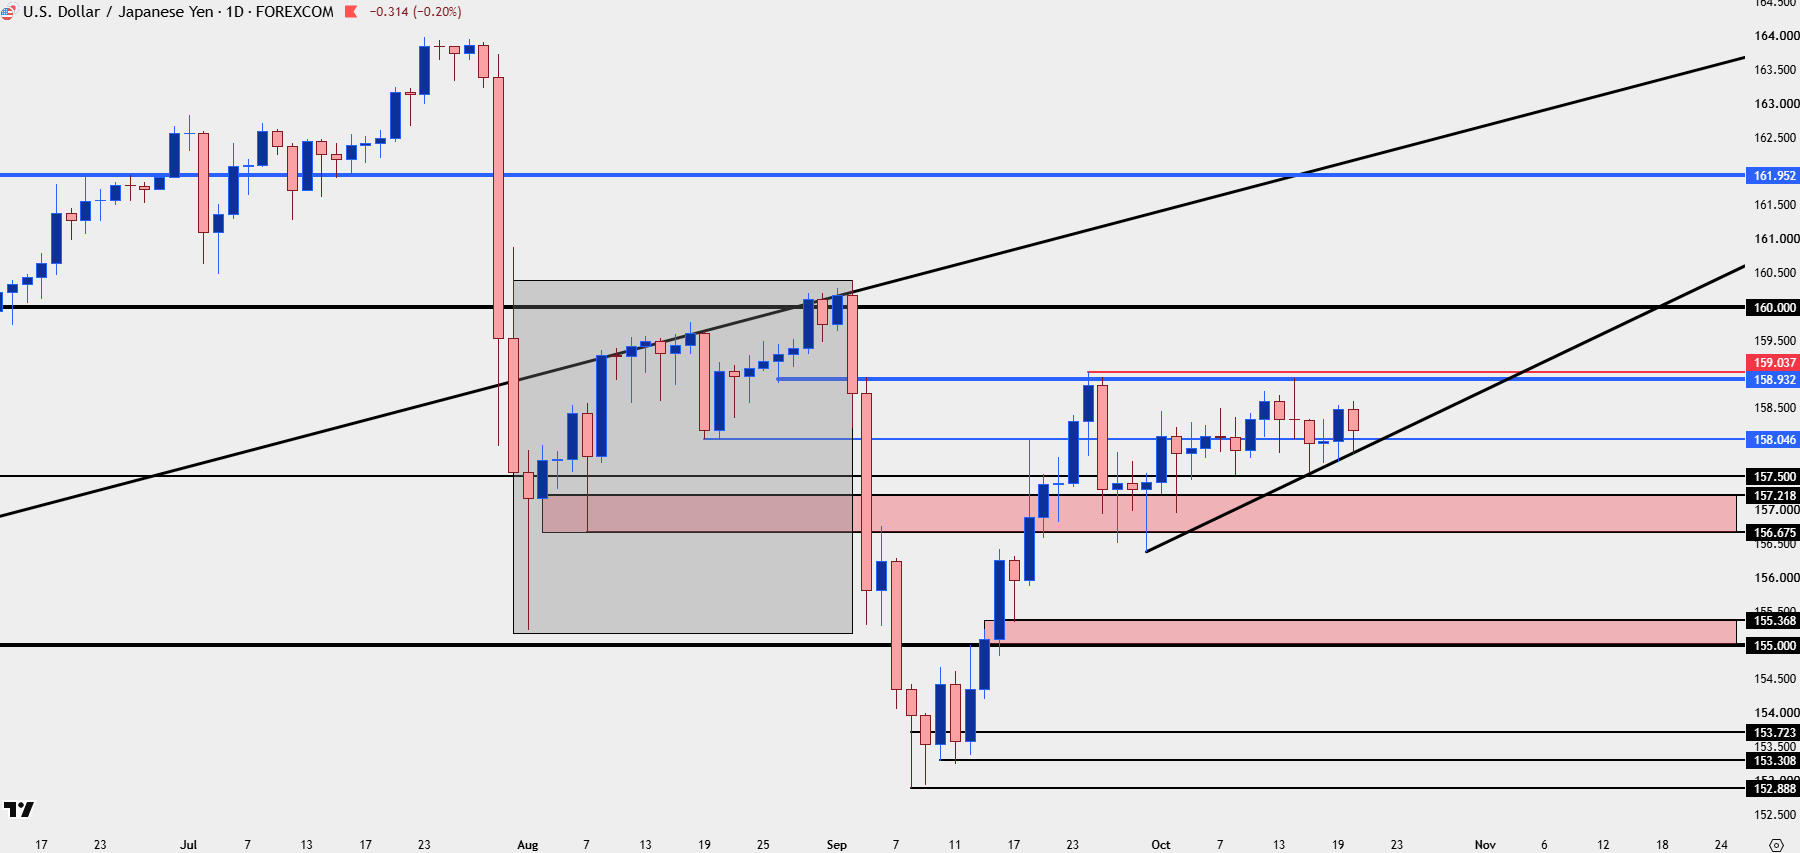
Chart prepared by James Stanley; data derived from Tradingview
USD/CAD
It’s gone from feast to famine for bulls in USD/CAD, as a consistent uptrend has pared back considerably over the past week, following a failure at 1.4300 after the US CPI release.
It’s the 1.4000 level that stands out here, and there’s already been a response from just above that price at 1.4030 which is the 50% mark of the September-October rally. This could be an area of interest for a bounce play, particularly for bullish-USD scenarios.
USD/CAD Daily Chart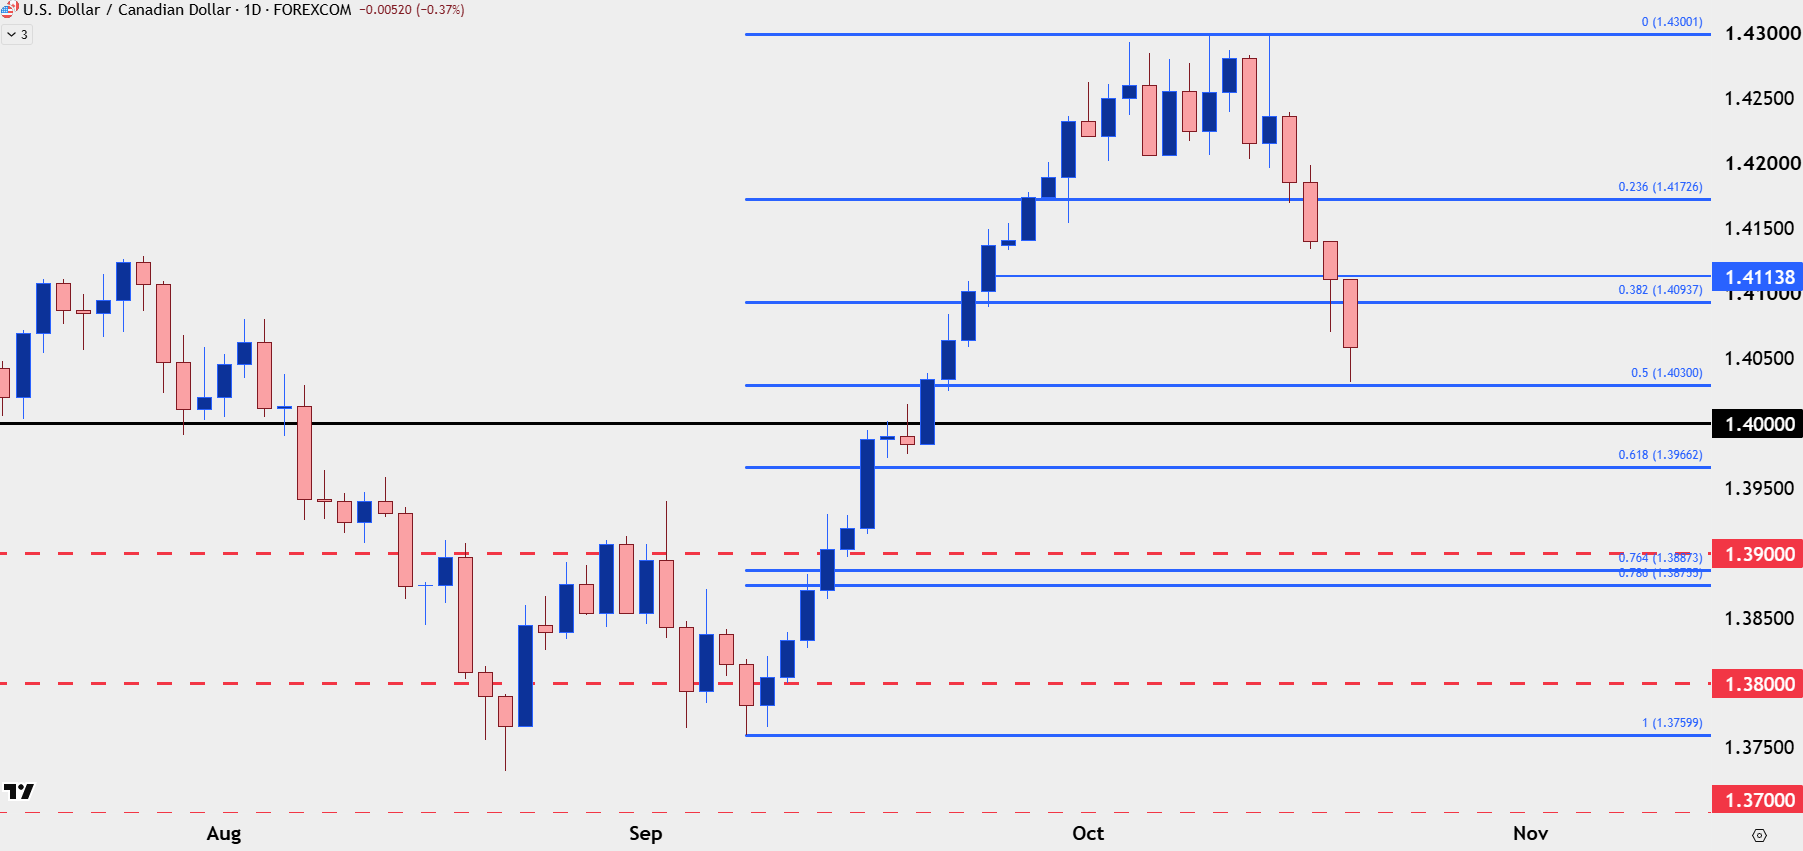
Chart prepared by James Stanley; data derived from Tradingview
--- written by James Stanley, Senior Market Analyst, Global Macro

Open an account in minutes
Experience award-winning platforms with fast and secure execution.
Economic calendar
Web Trader platform
Our sophisticated web-based platform is packed with features.
Related articles

NZD/USD Forecast: Kiwi faces historic breakdown as RBNZ survey looms
NZD/USD is teetering above support that held through the pandemic and Liberation Day turmoil. With RBNZ hawks repeatedly disappointed, today's inflation expectations survey could open the door to a slide towards the GFC lows.

USD/JPY, AUD/JPY: Central Bank Divergence Creates Two-Way Risk
USD/JPY eyes a breakout above 160, while AUD/JPY faces further losses as Fed, RBA and BoJ interest rate expectations diverge.


DXY, GBP/USD, AUD/USD, USD/CAD, USD/JPY, Gold Weekly Technical Outlook 11 16 2026
Sr. Technical Strategist Michael Boutros highlights the levels that matter on the USD Majors, commodities, and equity indices charts this week.

StoneX Financial Ltd (trading as "FOREX.com") is an execution-only service provider. This material, whether or not it states any opinions, is for general information purposes only and it does not take into account your personal circumstances or objectives. This material has been prepared using the thoughts and opinions of the author and these may change. However, FOREX.com does not plan to provide further updates to any material once published and it is not under any obligation to keep this material up to date.
This material is short term in nature and may only relate to facts and circumstances existing at a specific time or day. Nothing in this material is (or should be considered to be) financial, investment, legal, tax or other advice and no reliance should be placed on it. No opinion given in this material constitutes a recommendation by FOREX.com or the author that any particular investment, security, transaction or investment strategy is suitable for any specific person.
The material has not been prepared in accordance with legal requirements designed to promote the independence of investment research. Although FOREX.com is not specifically prevented from dealing before providing this material, FOREX.com does not seek to take advantage of the material prior to its dissemination. This material is not intended for distribution to, or use by, any person in any country or jurisdiction where such distribution or use would be contrary to local law or regulation. For further details see our full non-independent research disclaimer and quarterly summary.