



US Dollar Price Action Setups: EUR/USD, USD/JPY, GBP/USD
There’s been chaotic movements in several macro markets and a number of correlations have aligned, although that can change quickly. The US Dollar, however, presents a case on both sides depending on the time frame examined, explored further in this week’s price action webinar.
Share this:

US Dollar
The daily and weekly charts of the US Dollar retain bullish potential and given the continued tension in the Middle East I think it’s clear what drives that scenario. The knock-on effect of that is USD/JPY, and whether the BoJ will be ordered to intervene in effort of knocking the pair back-below the 160.00 handle. Earlier in the week there were more intervention threats out of Japan and that did bring a pullback, but since then, bulls have pushed price right back up to resistance.
In the USD, there’s an ascending triangle formation very similar to the one that had built in February leading into the March breakout. The resistance line-in-the-sand is around the 100-handle, which has been bend without break kind of scenario of late.
US Dollar Daily Chart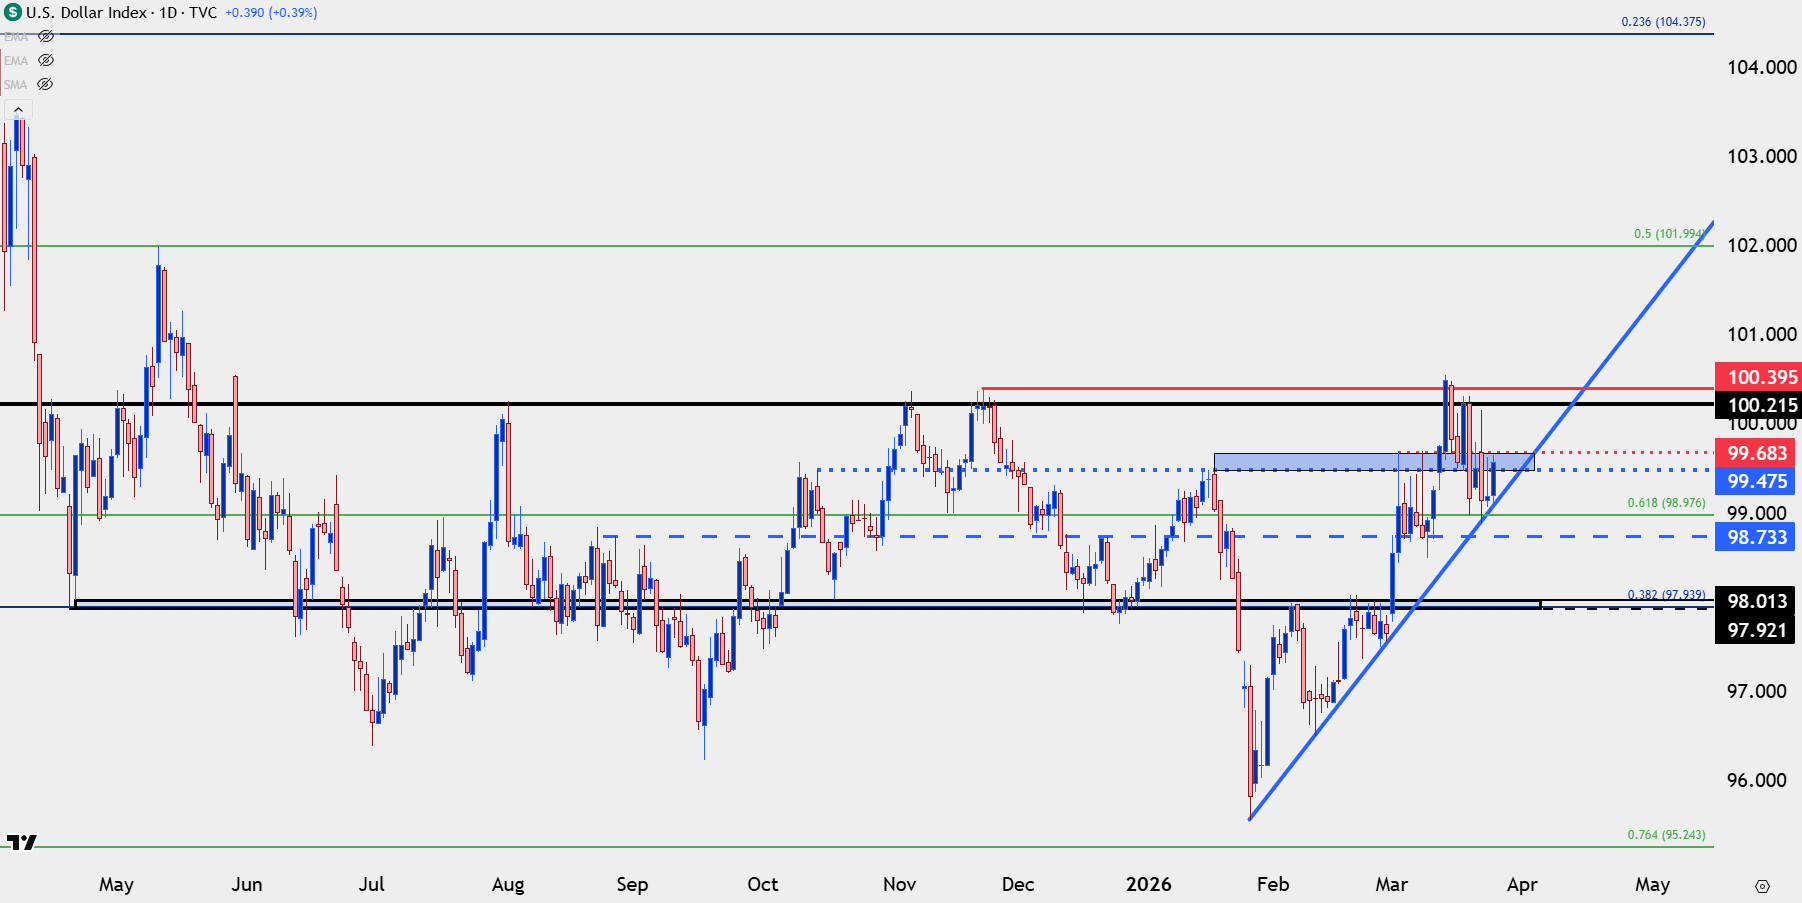
Chart prepared by James Stanley; data derived from Tradingview
USD Shorter-Term
For USD bears, it’s the shorter-term build of lower-lows and highs that they’d likely want to focus on. For now, there’s support bouncing from the bullish trendline that held the lows in late-February in DXY, and resistance is playing at a familiar zone between 99.48-99.68, which was resistance after the initial breakout in early-March before coming in as support a couple weeks later.
US Dollar Four-Hour Chart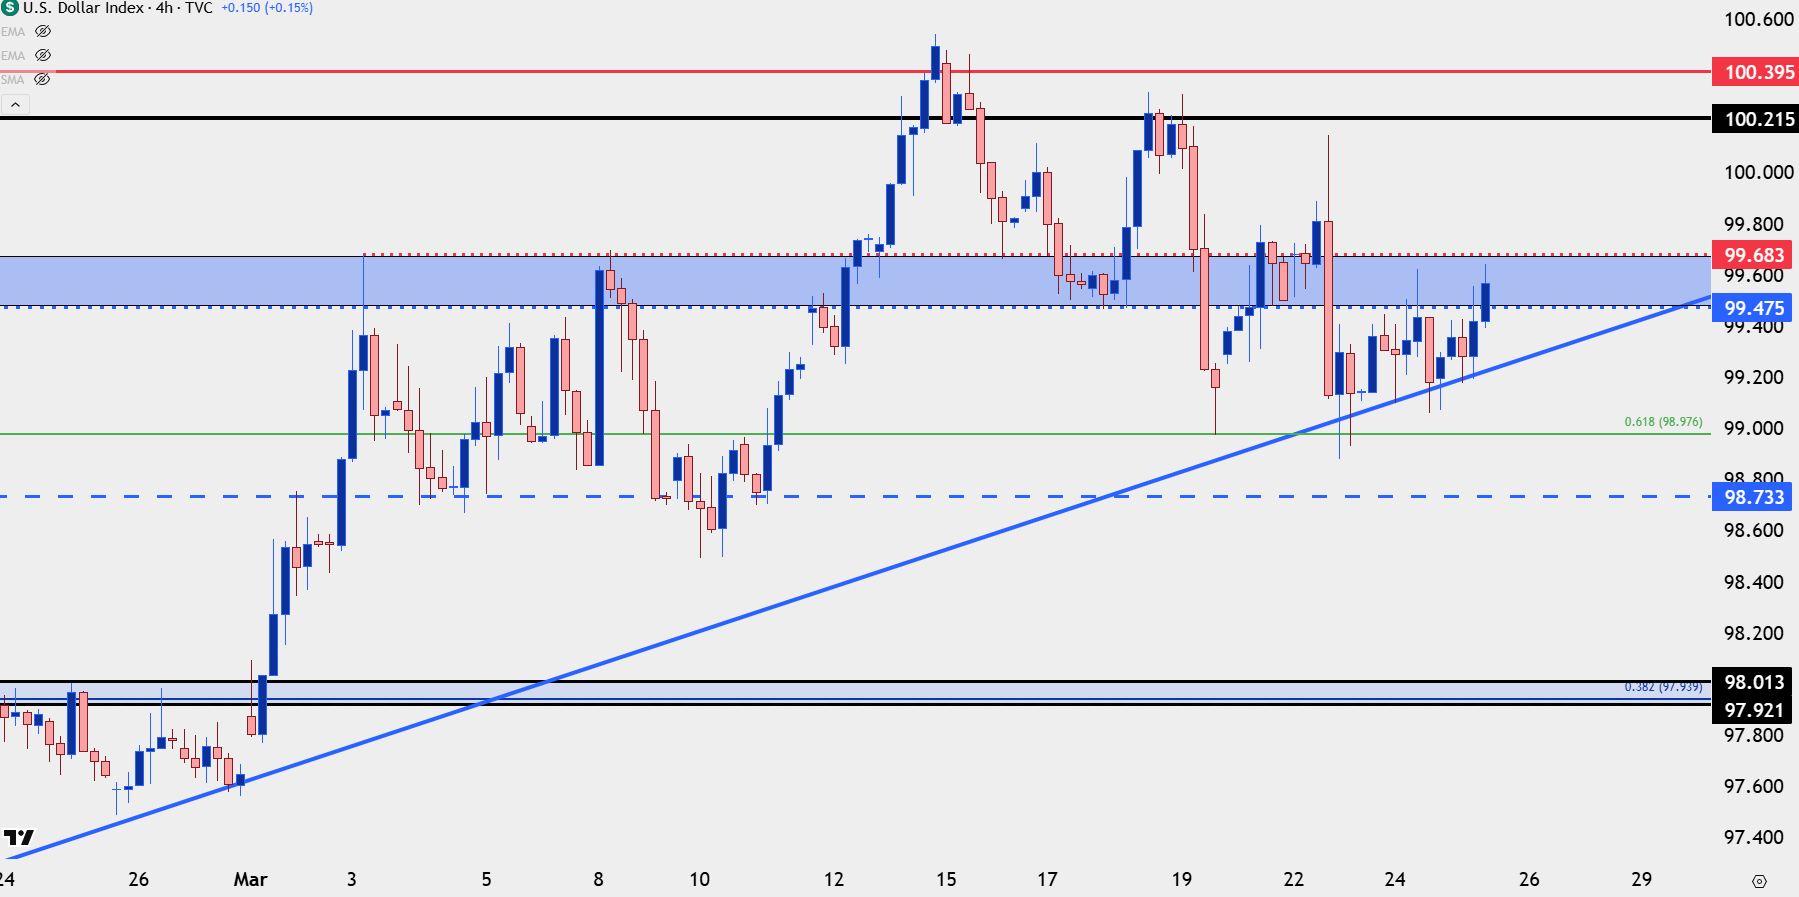
Chart prepared by James Stanley; data derived from Tradingview
EUR/USD
The largest component of the DXY basket is in a similar contradictory state between daily and four-hour charts. For EUR/USD bulls, it’s the fundamental divergence that I think stands out as this fall in the pair accompanied a fast rise in European rate expectations into Central Bank week. There’s been a build of support on a short-term basis, mirroring the lower-lows and lower-highs of DXY above, and this is what EUR/USD bulls are likely going to want to focus on, for now.
But, from the daily I think it’s simple to consider this as a bearish scenario given that there’s a continued tug of war around what can be considered a lower-high.
EUR/USD Daily Price Chart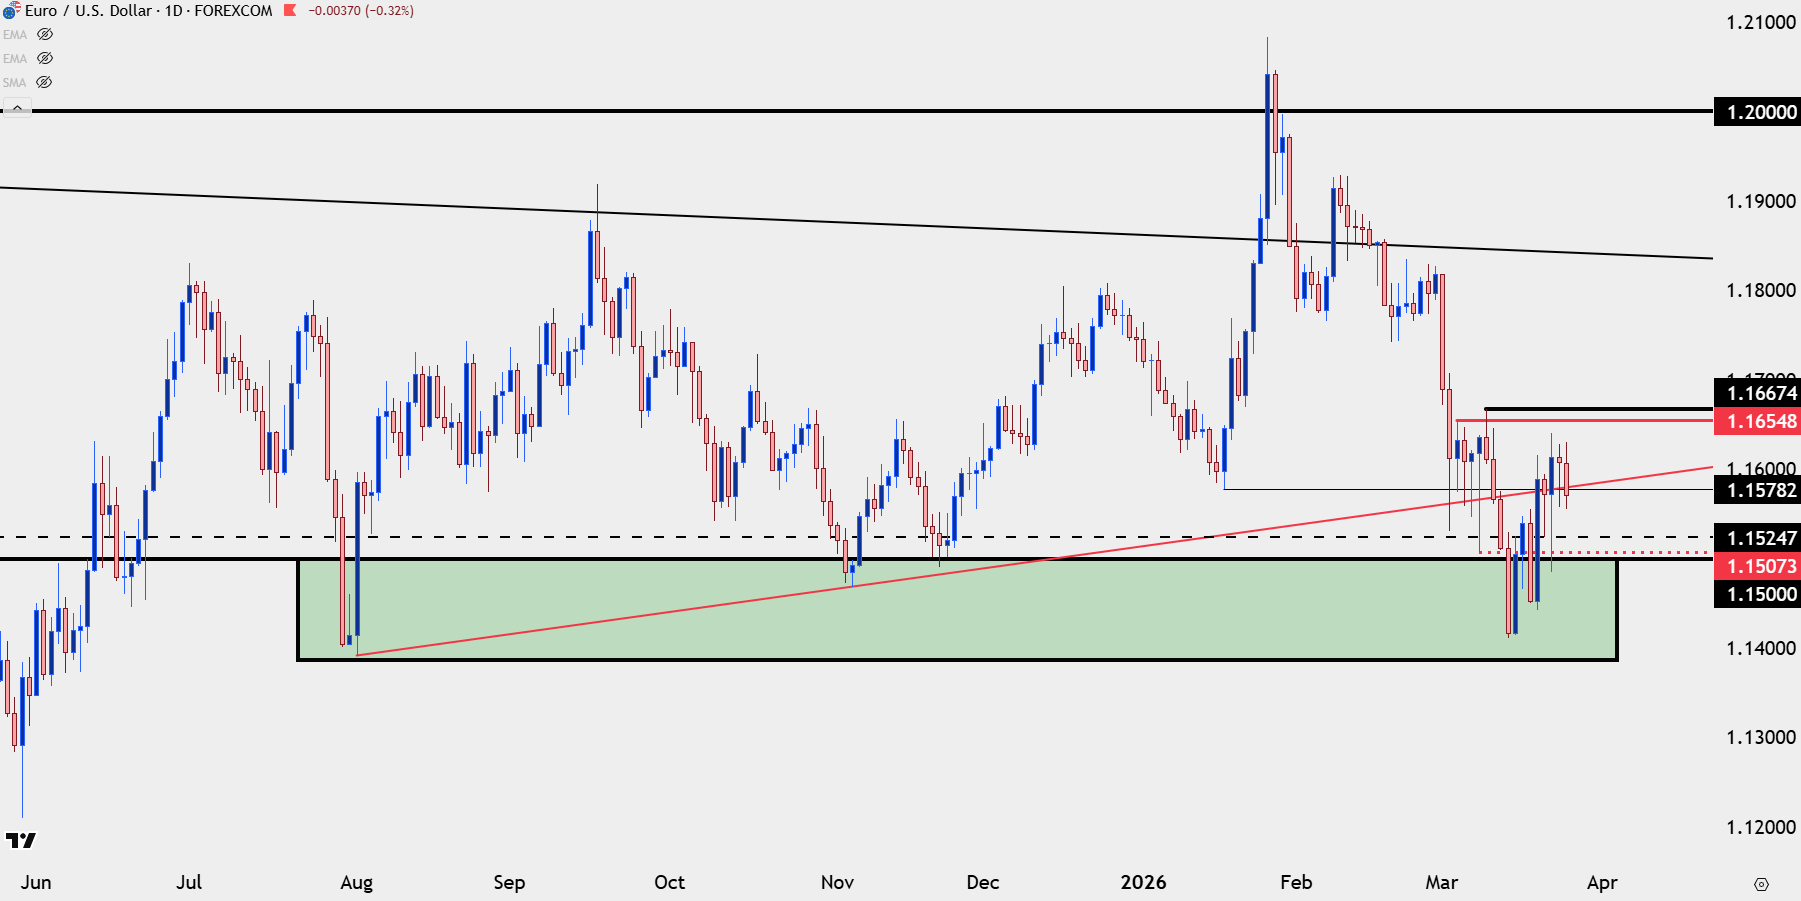
Chart prepared by James Stanley; data derived from Tradingview
EUR/USD Shorter-Term
The four-hour chart shows a grinding backdrop of recent higher-highs and lows and notably that sequencing has continued since the ECB rate decision last week. But, bulls remain cautious as pushes up to higher-highs haven’t exactly led to strong breakout themes so it seems as though this situation is still awaiting a catalyst or driver.
EUR/USD Four-Hour Chart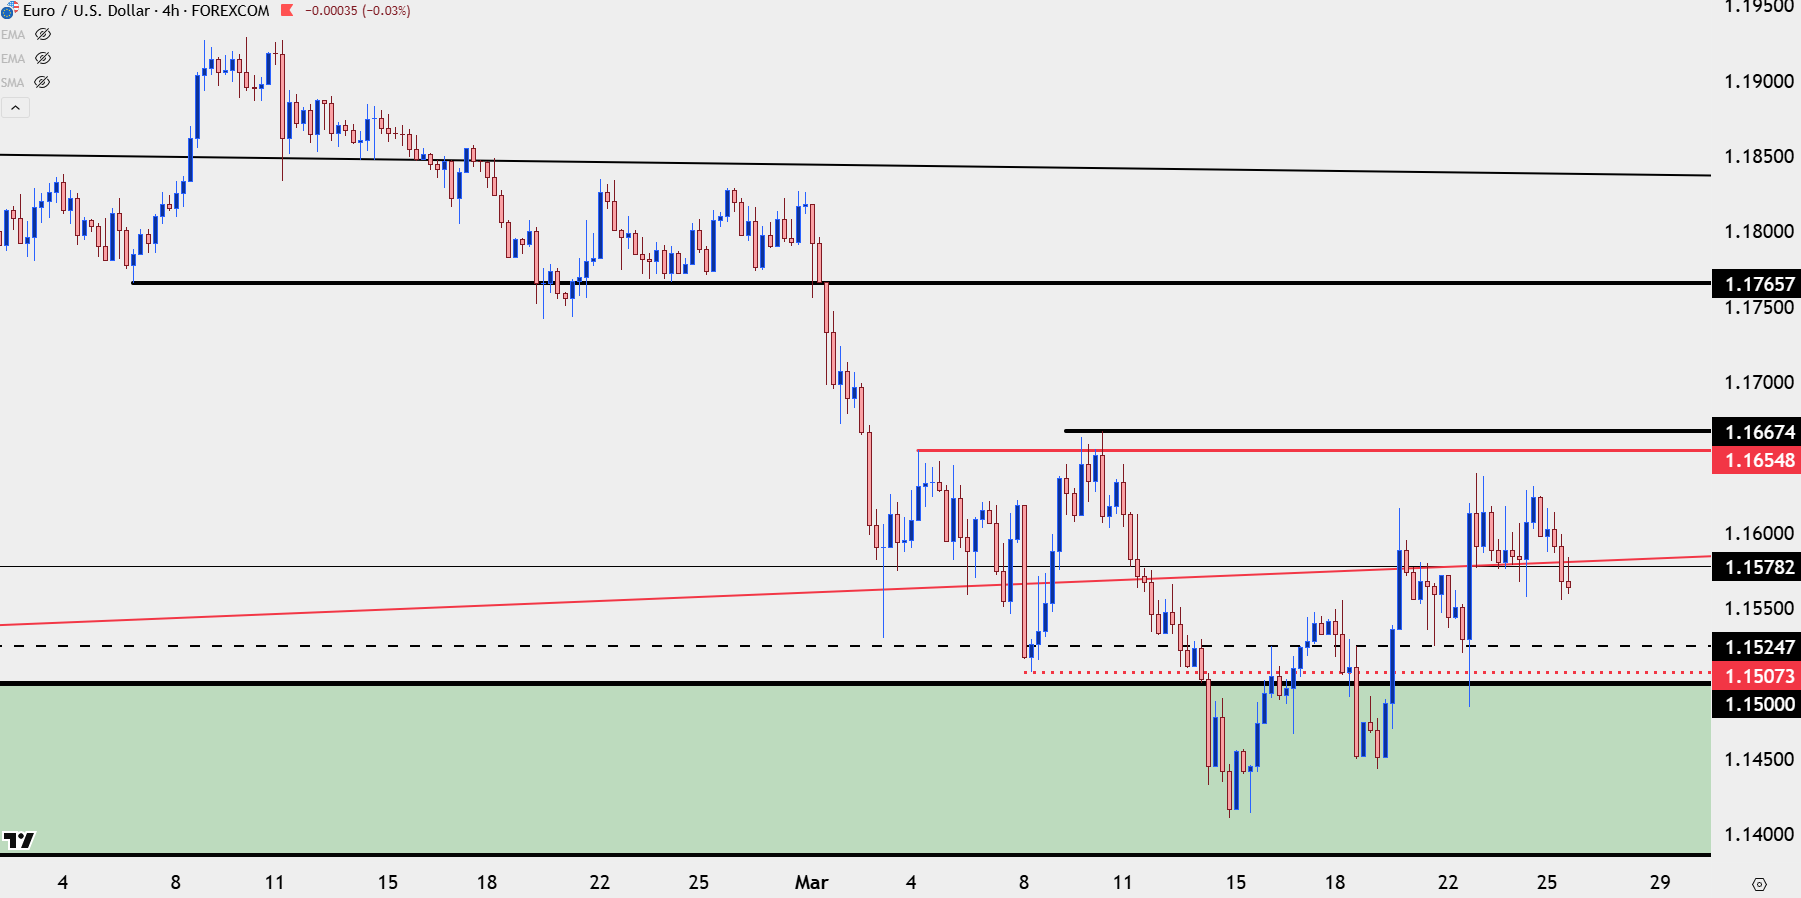
Chart prepared by James Stanley; data derived from Tradingview

GBP/USD
For USD-weakness, I still prefer GBP/USD, and the recent pullback from the bearish trend illustrates a few items that I think keeps that theme of interest. While EUR/USD hasn’t yet re-tested the March 10th high, substantiating a lower-high on the daily chart, GBP/USD has come closer to that, which highlights a deduction of greater strength in Sterling versus the Euro.
The daily chart here, while not quite in a bullish reversal state, has a series of recent higher-lows to go along with that test back above the 1.3400 handle.
GBP/USD Daily Chart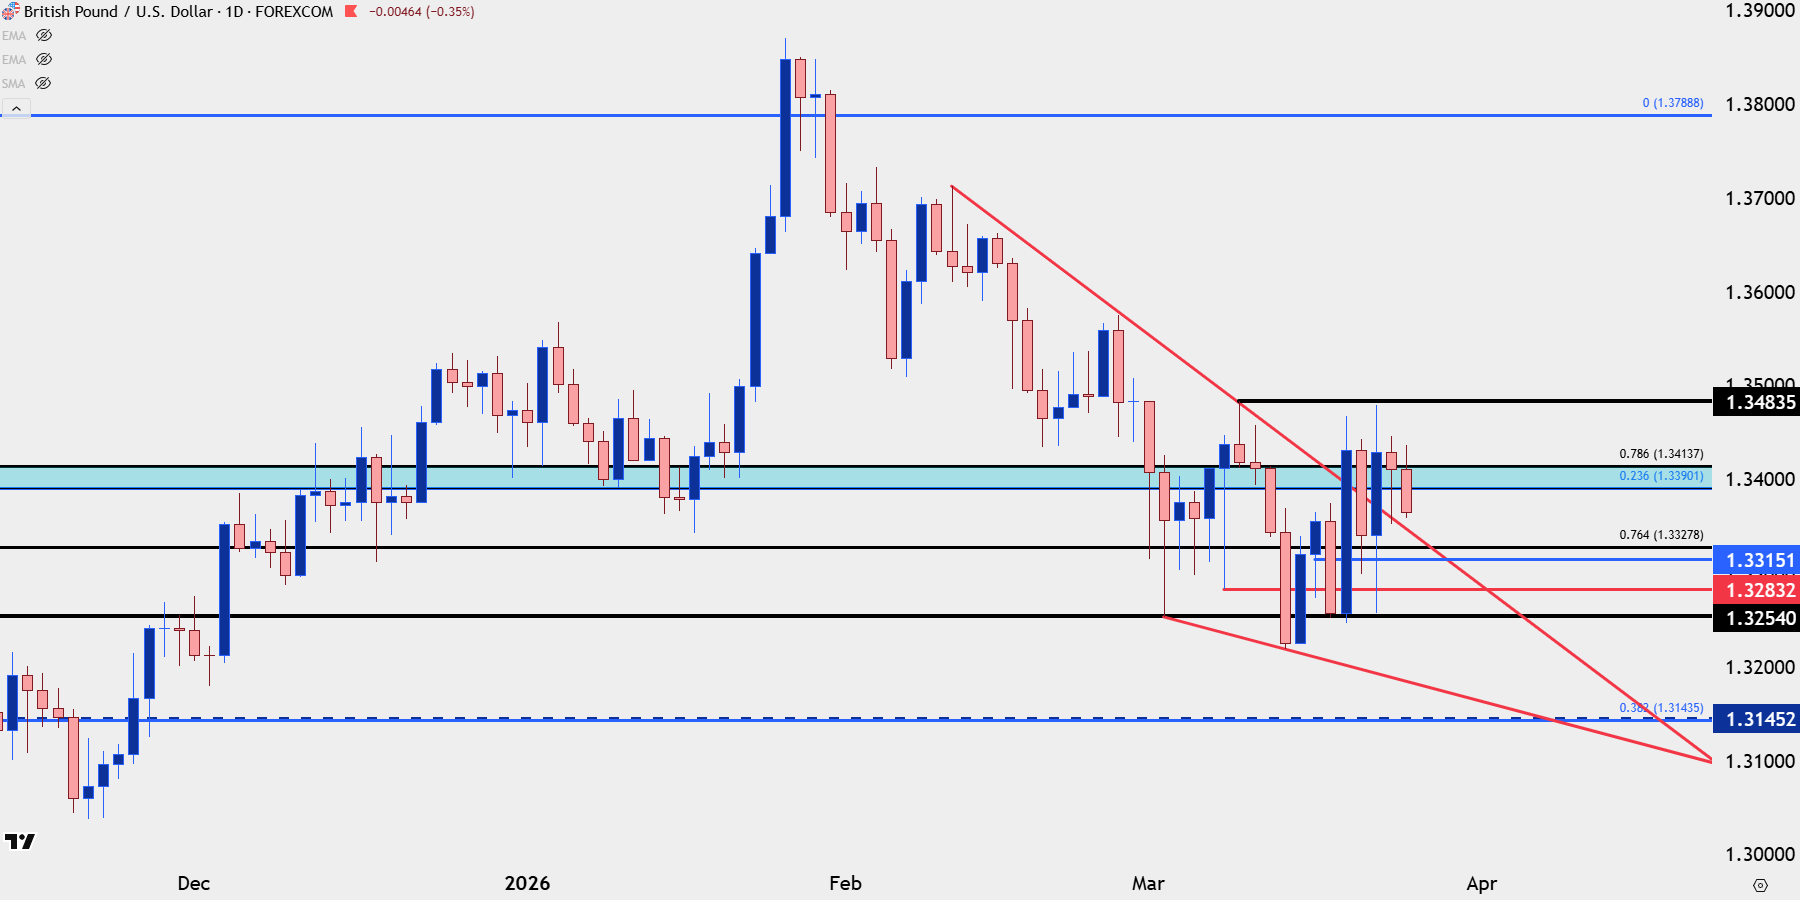
Chart prepared by James Stanley; data derived from Tradingview
USD/JPY
USD/JPY is making another push back up towards the 160.00 level and earlier this week we heard comments from Japan’s top currency diplomat that threatened intervention. That brought a pullback on Monday but not much else, and prices are now back to the same level they were at after the weekly open around when those comments hit the wire.
If we do see a 160.00 test I think we could see an intervention. The bigger question is whether it would work or, like in April of 2024, if that was merely a pullback that drew bulls in after a support test.
But, perhaps more importantly, a pullback in the crowded USD/JPY backdrop could bring with it a broader swell of USD-weakness, such as we saw in late-January which helped EUR/USD to pop above the 1.2000 handle while going into overbought territory on daily RSI.
USD/JPY Daily Price Chart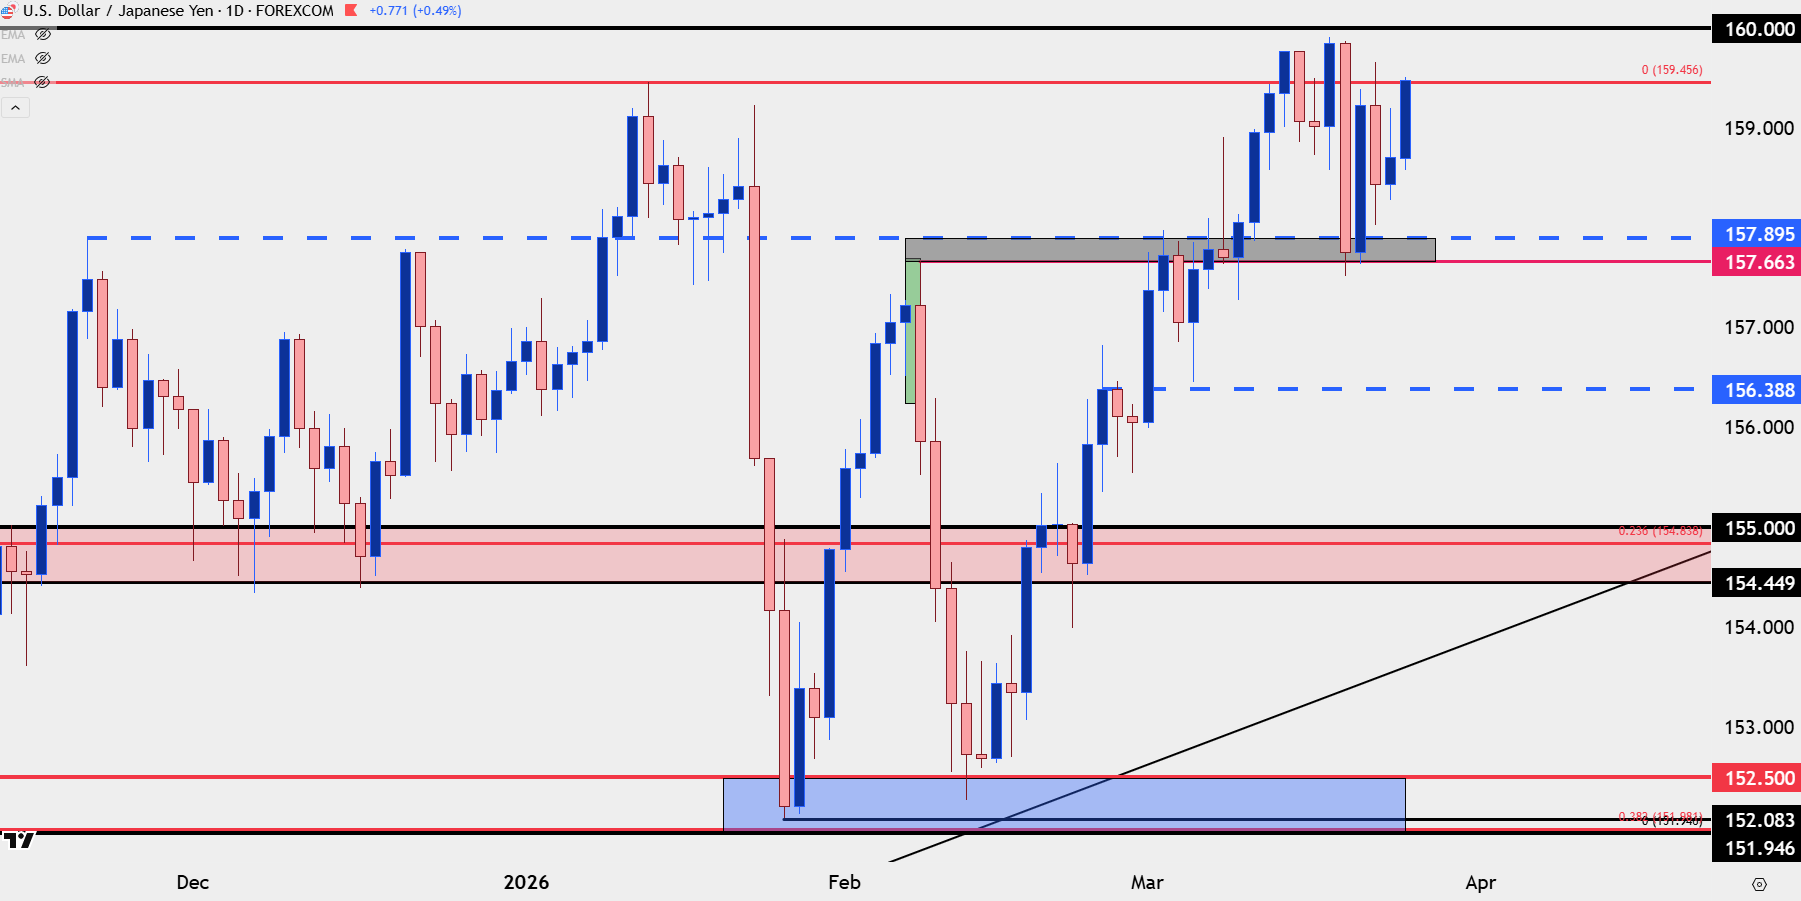
Chart prepared by James Stanley; data derived from Tradingview
--- written by James Stanley, Senior Market Analyst, Global Macro

Open an account in minutes
Experience award-winning platforms with fast and secure execution.
Economic calendar
Web Trader platform
Our sophisticated web-based platform is packed with features.
Related articles

USD/JPY, AUD/JPY: Central Bank Divergence Creates Two-Way Risk
USD/JPY eyes a breakout above 160, while AUD/JPY faces further losses as Fed, RBA and BoJ interest rate expectations diverge.


DXY, GBP/USD, AUD/USD, USD/CAD, USD/JPY, Gold Weekly Technical Outlook 11 16 2026
Sr. Technical Strategist Michael Boutros highlights the levels that matter on the USD Majors, commodities, and equity indices charts this week.


S&P, Nasdaq Slide as NVDA, AI Worries Continue to Build
It was a busy weekend in the headlines as a campaign to bring back Jensen Huang atop NVDA gained steam, even with accusations of possible treason and a circular funding model that has started to raise questions.
StoneX Financial Ltd (trading as "FOREX.com") is an execution-only service provider. This material, whether or not it states any opinions, is for general information purposes only and it does not take into account your personal circumstances or objectives. This material has been prepared using the thoughts and opinions of the author and these may change. However, FOREX.com does not plan to provide further updates to any material once published and it is not under any obligation to keep this material up to date.
This material is short term in nature and may only relate to facts and circumstances existing at a specific time or day. Nothing in this material is (or should be considered to be) financial, investment, legal, tax or other advice and no reliance should be placed on it. No opinion given in this material constitutes a recommendation by FOREX.com or the author that any particular investment, security, transaction or investment strategy is suitable for any specific person.
The material has not been prepared in accordance with legal requirements designed to promote the independence of investment research. Although FOREX.com is not specifically prevented from dealing before providing this material, FOREX.com does not seek to take advantage of the material prior to its dissemination. This material is not intended for distribution to, or use by, any person in any country or jurisdiction where such distribution or use would be contrary to local law or regulation. For further details see our full non-independent research disclaimer and quarterly summary.