



USD Pulls Back on Ceasefire Hopes: USD/JPY, EUR/USD, GBP/USD
USD/JPY has pulled back quickly from yesterday’s test of 160.00 and that’s driven a wave of selling in the USD, driven by hopes that the ceasefire around Iran will mark an eventual end to the conflict. It’s still early, though.
Share this:

The US Dollar has put in a fast pullback on the back of ceasefire hopes in Iran. It’s still early though, and there’s already reports that the ceasefire may not hold as highlighted by a couple of items early in the above video.
From a markets perspective the ceasefire announcement led to a scaling-back in some of the tension that’s shown and in FX markets, that’s the 160.00 level in USD/JPY. That price was tested around yesterday’s webinar but hopes then showed up that President Trump’s deadline may get pushed back. On the actual announcement later that night, several risk-on moves showed with gold breaking out, stocks continuing their rally and USD/JPY pulling back from the 160.00 handle.
The EUR/USD and GBP/USD setups looked at in yesterday’s webinar stretched with strong rallies.
In the DXY basket, we now have a test of a lower-low and there’s a big spot of support a little lower, around the 97.94 Fibonacci level that was ascending triangle resistance in February, ahead of the March breakout fueled by the conflict in Iran.
US Dollar Daily Price Chart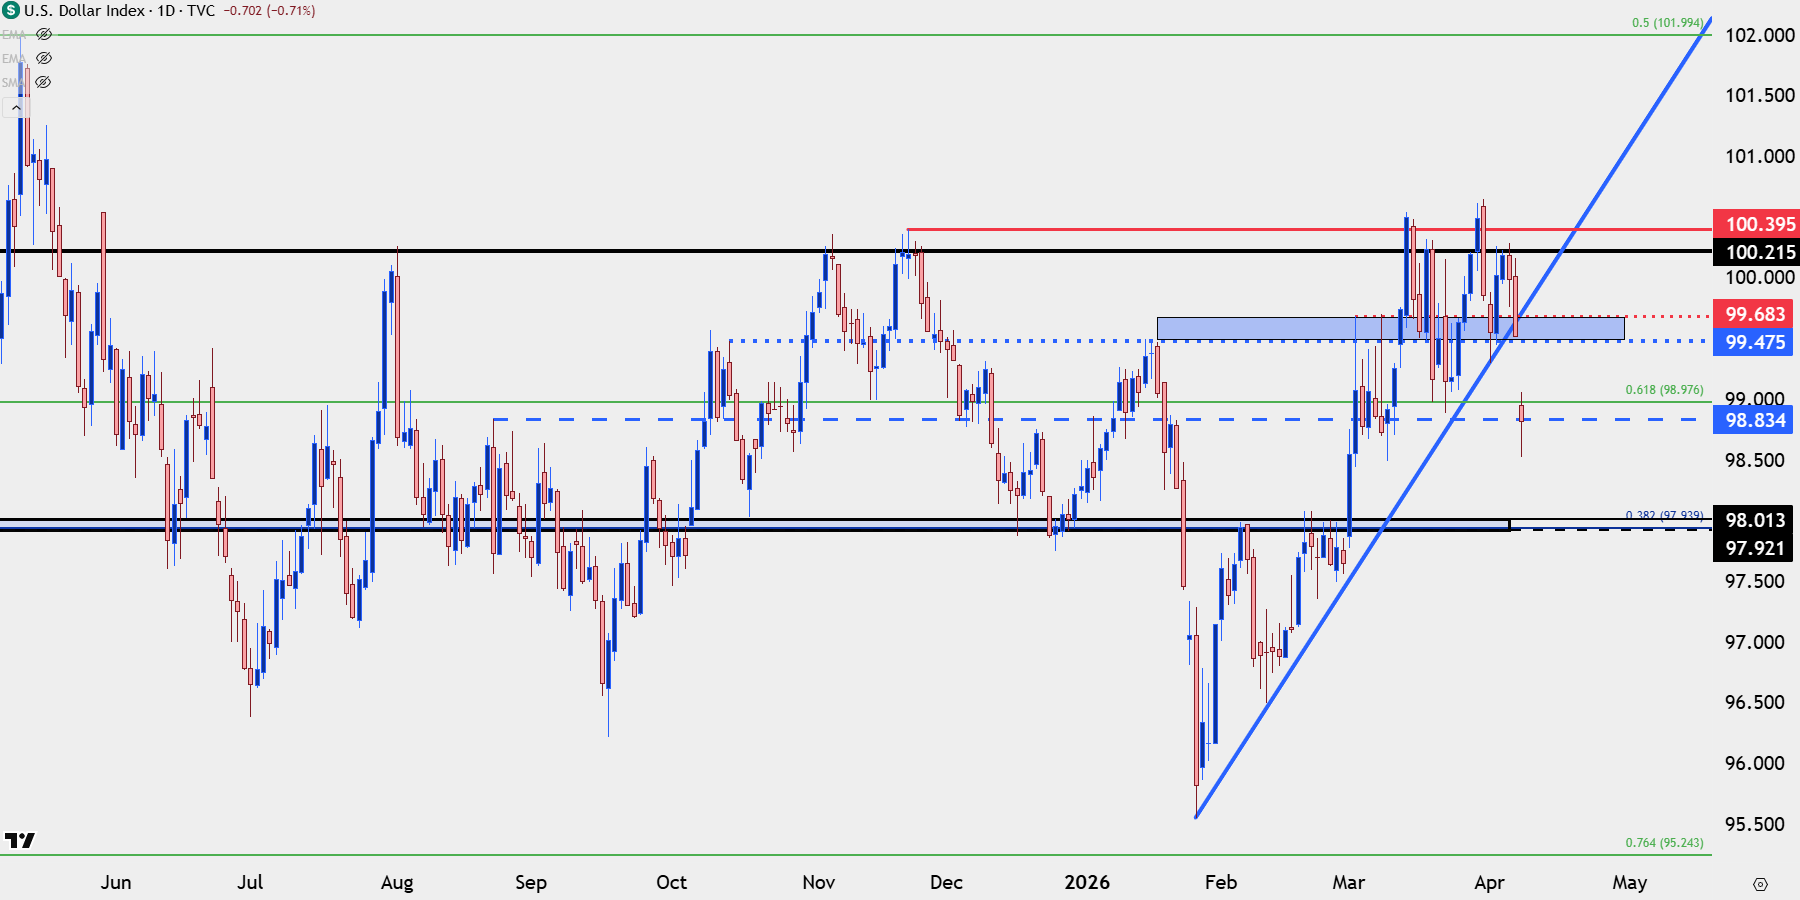
Chart prepared by James Stanley; data derived from Tradingview
USD/JPY
I remain of the mind that USD/JPY is the big push point for USD trends across the FX market, and the longer-term move in the pair illustrates why. The trade is still crowded and the rate divergence between the two economies still provides bullish motive.
Notably, it’s US CPI prints that drove reversals/pullbacks in 2022 and 2023, along with the bullish breakout in April of 2024, and we’re getting a very important US CPI print on Friday of this week.
If we do see continued tension in the Middle East, that’s a push on the long side of oil prices, which also pushes on higher inflation. This gives USD/JPY bulls a reason to push breakouts and the Bank of Japan is in the difficult spot of defending a line-in-the-sand that’s already started to give way.
With tensions easing on the back of ceasefire hopes we’ve seen the pair pullback, but there’s still bullish structure here as we have a test of support at prior resistance, taken from around 157.66-157.90.
USD/JPY Daily Price Chart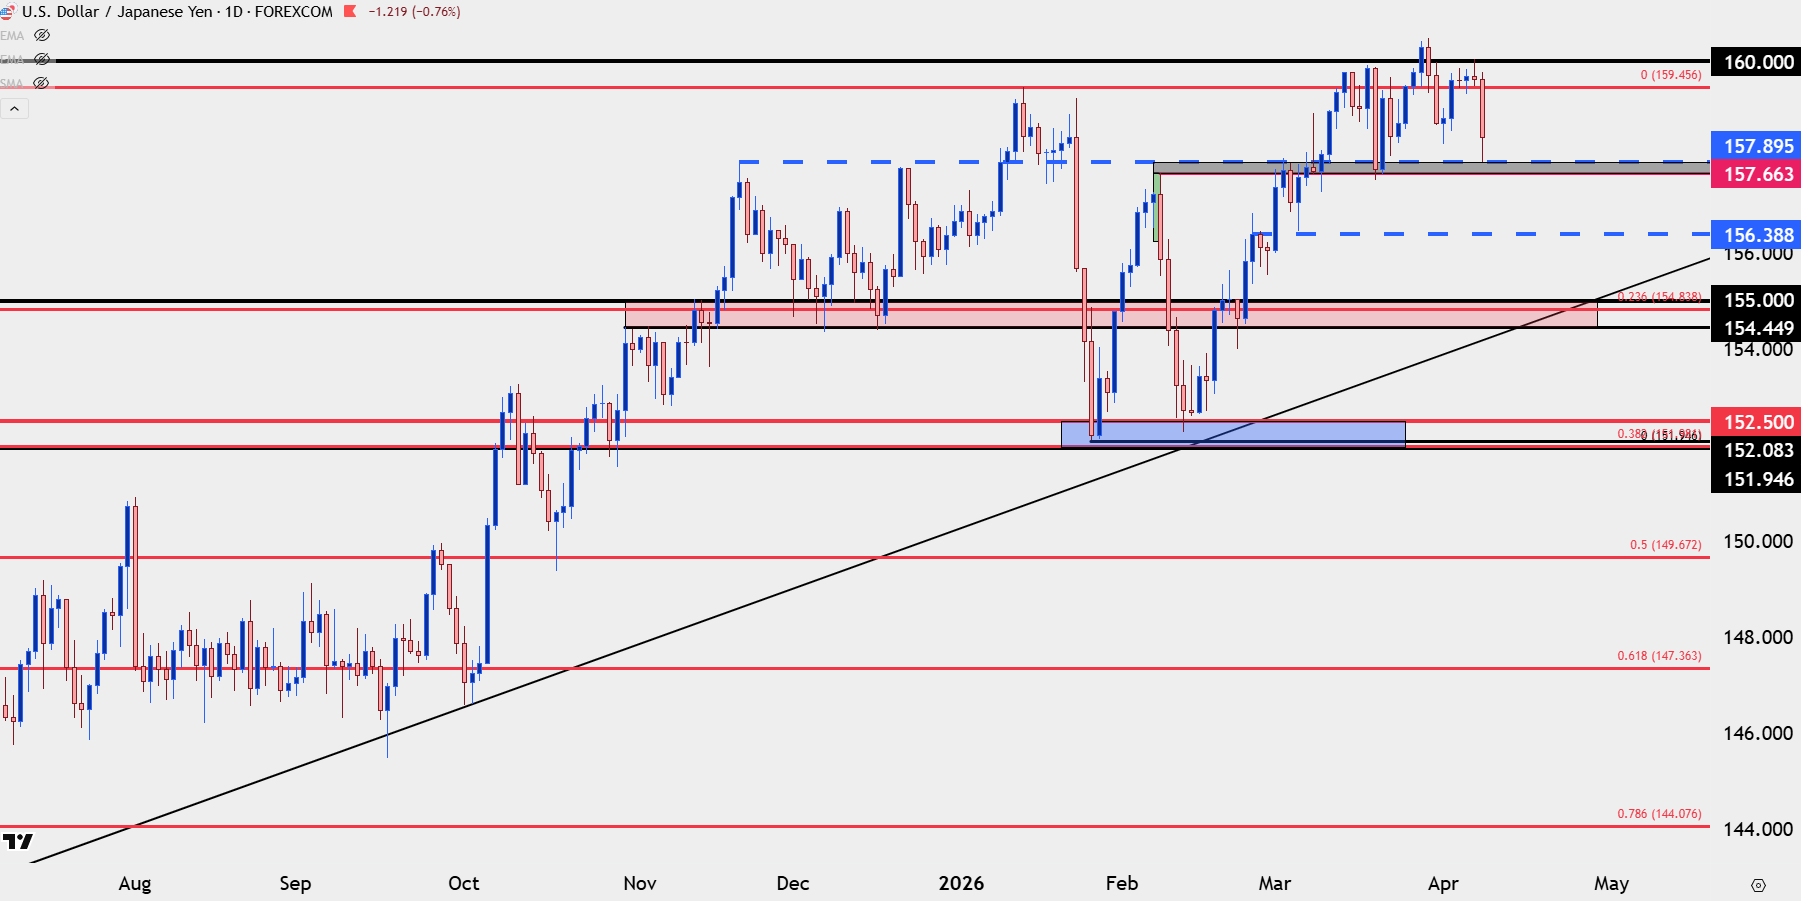
Chart prepared by James Stanley; data derived from Tradingview
EUR/USD Breakout
It’s the build of higher-lows over the past month that impressed in EUR/USD. The 1.1411 swing low was defended with a 1.1451 higher-low, and that spot held on a second test in late-March before a higher-low developed around the 1.1500 handle earlier this week.
That set the stage for last night’s breakout, and at this point there’s now bullish structure to work with on both the four-hour and daily charts.
Prior resistance is now support potential, spanning from 1.1628-1.1655. And next resistance is prior support from 1.1742-1.1766.
EUR/USD Four-Hour Price Chart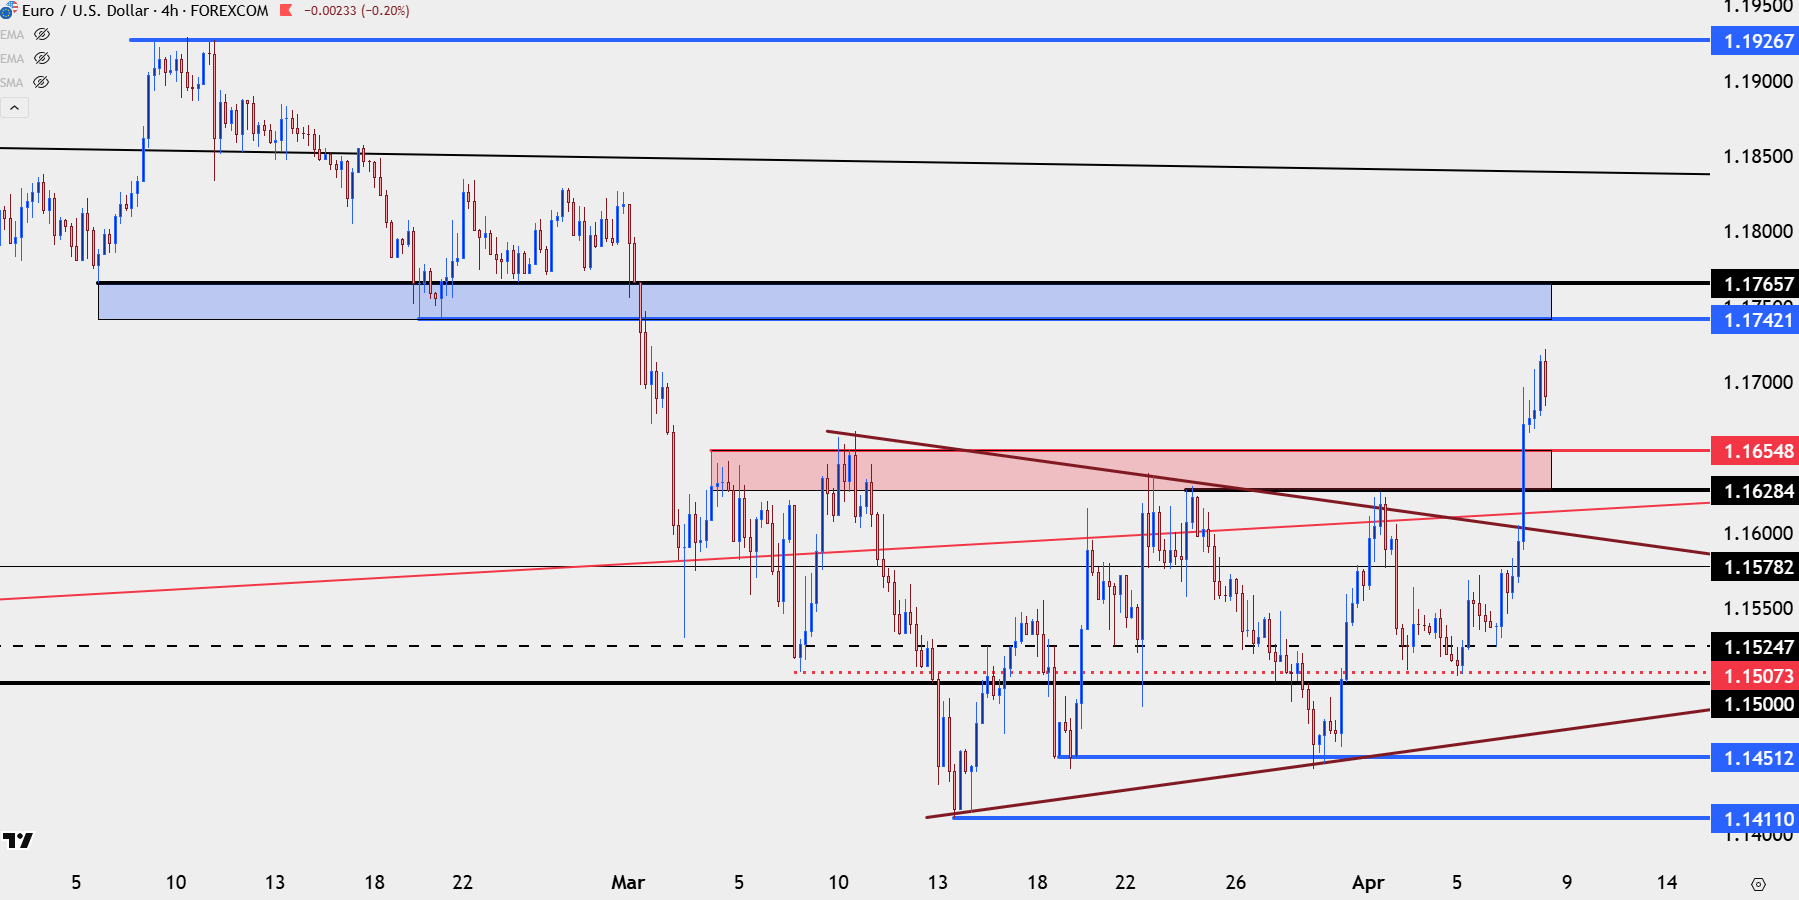
Chart prepared by James Stanley; data derived from Tradingview
EUR/GBP
While EUR/USD has shown more respectable bullish structure over the past month, EUR/GBP was indicating that change may be afoot, as the cross pair was testing a key zone of resistance at a Fibonacci level that I had looked at on Monday and Tuesday.
And with USD weakness coming in on the back of ceasefire hopes, both EUR/USD and GBP/USD have broken out, although the move in Cable has been approximately 25% larger than that in EUR/USD, as looked at in the above video.
This also shows in a resistance reaction in the cross-pair, as EUR/GBP has fallen from resistance and is now approaching a test of support at prior resistance.
EUR/GBP Daily Chart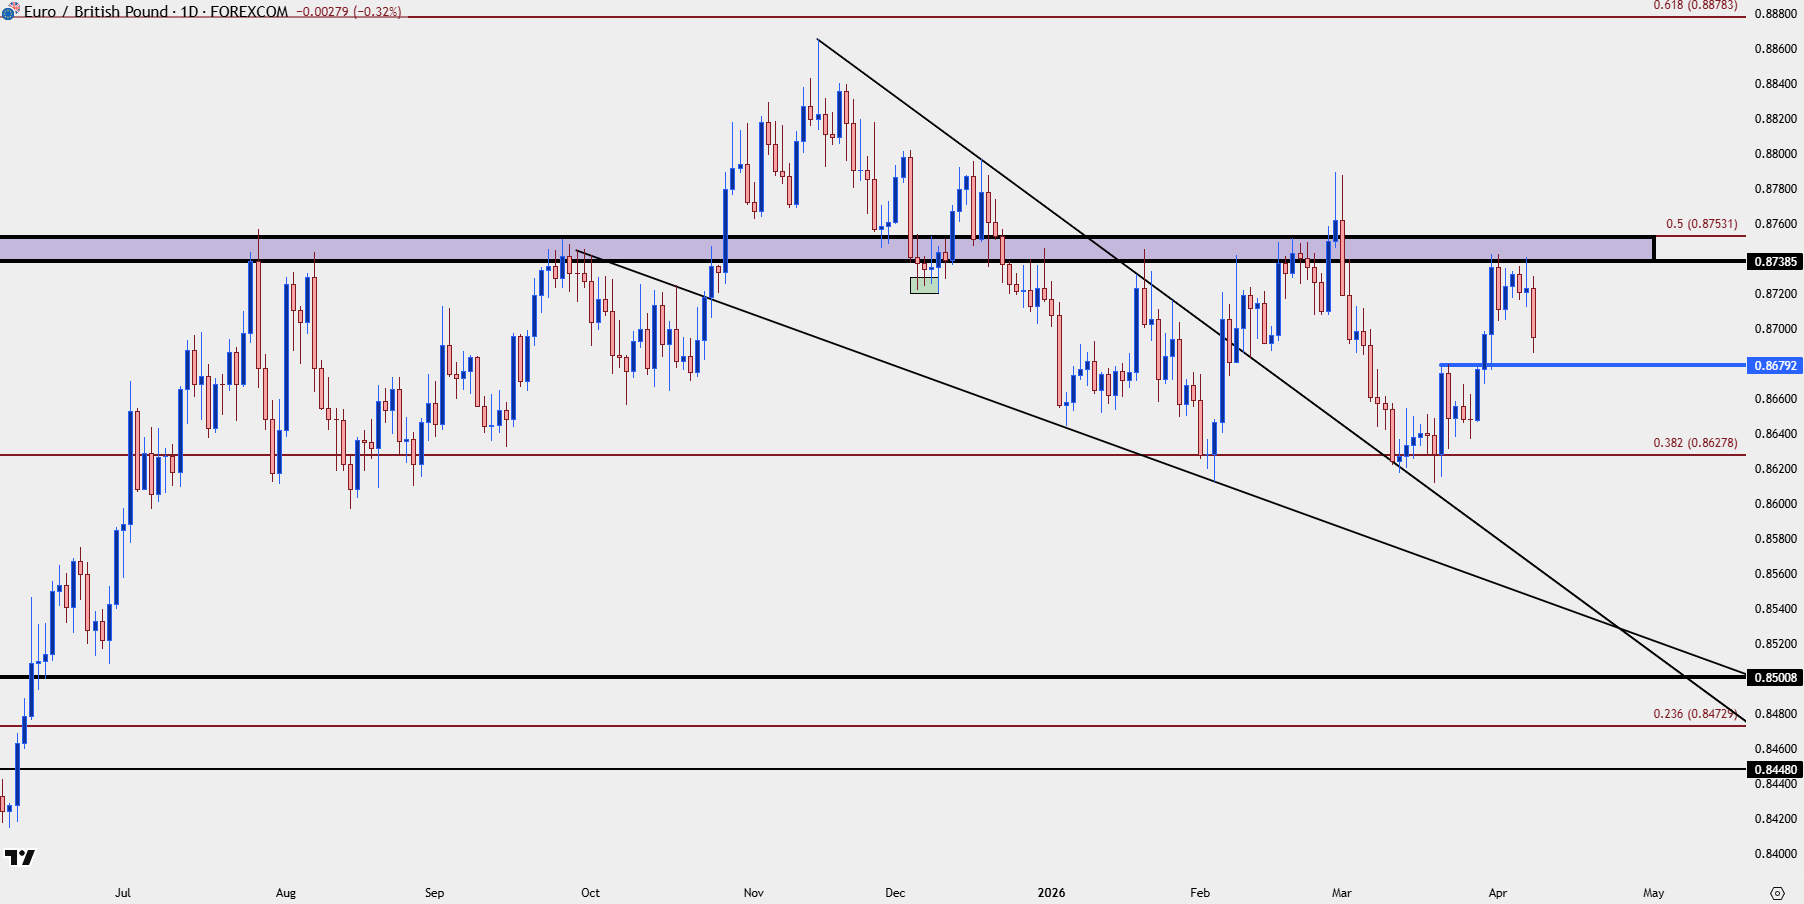
Chart prepared by James Stanley; data derived from Tradingview
GBP/USD
While EUR/USD has been working on higher lows over the past few weeks, GBP/USD has now. Even this week showed a re-test of support at the same level that was in-play previously and this was even as EUR/USD was setting up a higher-low at the 1.1500 level.
But, as USD-weakness has come on the jump in GBP/USD has been larger and from the daily chart, the falling wedge looked at in yesterday’s webinar has since led to a strong breakout in the pair, with price pushing up to prior resistance just inside of the 1.3500 handle.
At this point, there’s support potential at prior resistance, with the zone of 1.3414-1.3434 already close to coming back into play. Below that, there’s a swing level at 1.3373 and then a key zone from around 1.3250-1.3283.
GBP/USD Four-Hour Price Chart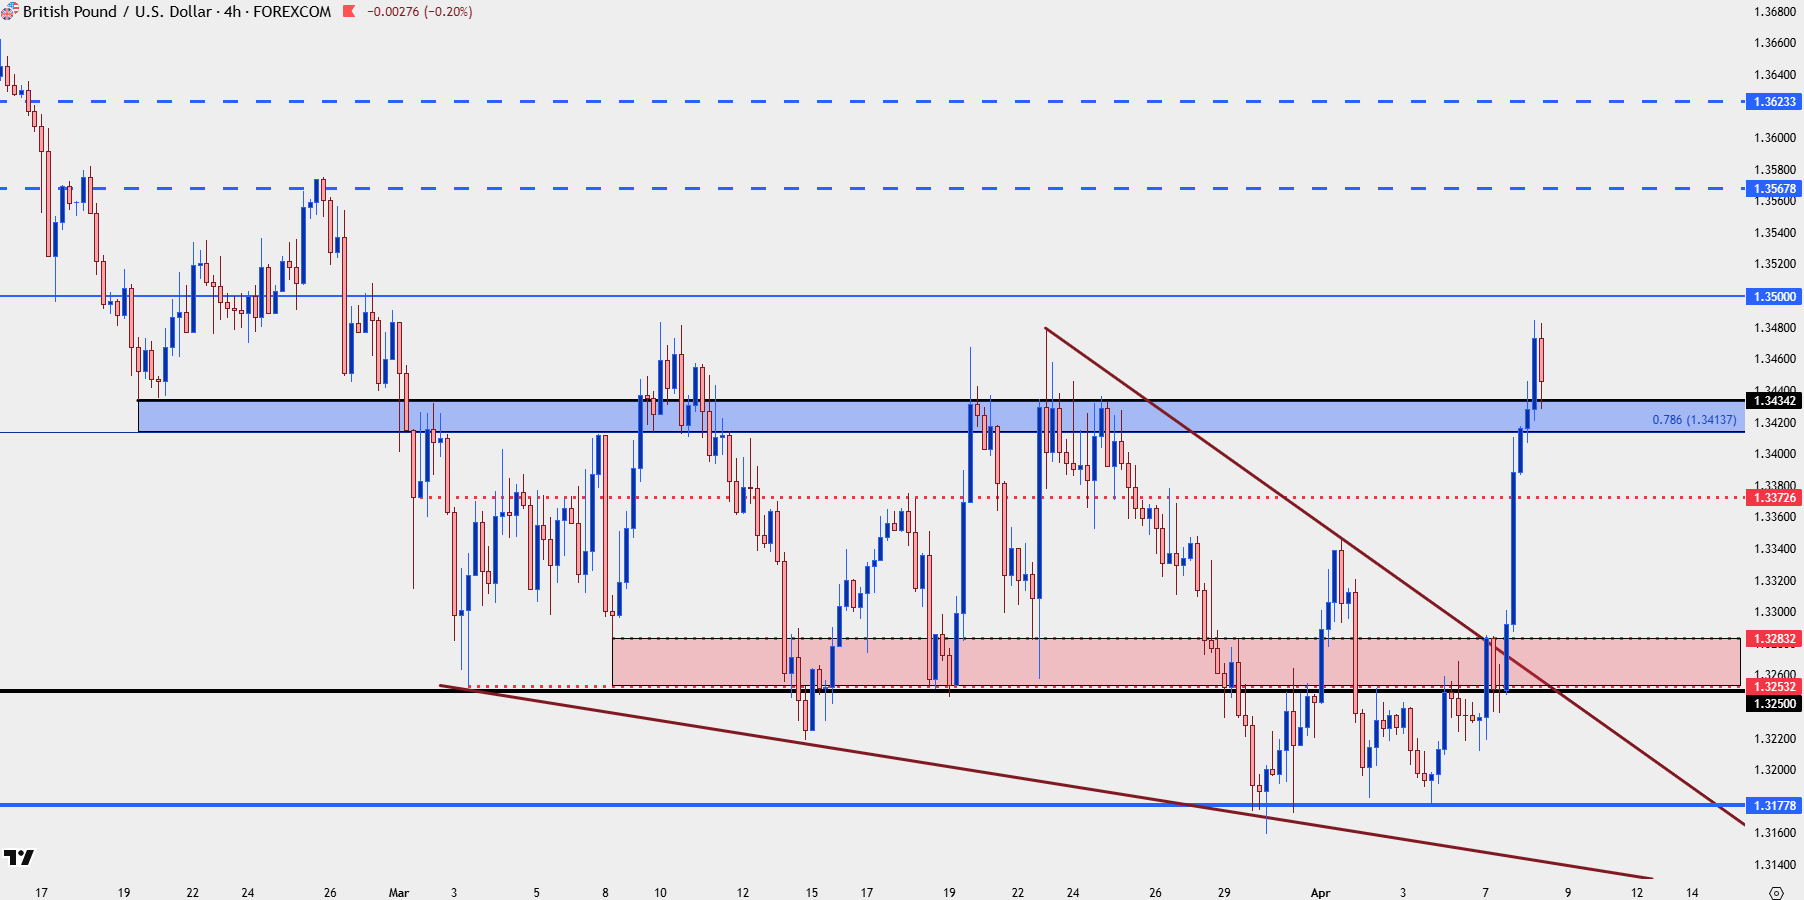
Chart prepared by James Stanley; data derived from Tradingview
--- written by James Stanley, Senior Market Analyst, Global Macro
Latest market news




Open an account in minutes
Experience award-winning platforms with fast and secure execution.
Economic calendar
Web Trader platform
Our sophisticated web-based platform is packed with features.
Related articles
USD/JPY, AUD/JPY: Central Bank Divergence Creates Two-Way Risk
USD/JPY eyes a breakout above 160, while AUD/JPY faces further losses as Fed, RBA and BoJ interest rate expectations diverge.

DXY, GBP/USD, AUD/USD, USD/CAD, USD/JPY, Gold Weekly Technical Outlook 11 16 2026
Sr. Technical Strategist Michael Boutros highlights the levels that matter on the USD Majors, commodities, and equity indices charts this week.

S&P, Nasdaq Slide as NVDA, AI Worries Continue to Build
It was a busy weekend in the headlines as a campaign to bring back Jensen Huang atop NVDA gained steam, even with accusations of possible treason and a circular funding model that has started to raise questions.
StoneX Financial Ltd (trading as "FOREX.com") is an execution-only service provider. This material, whether or not it states any opinions, is for general information purposes only and it does not take into account your personal circumstances or objectives. This material has been prepared using the thoughts and opinions of the author and these may change. However, FOREX.com does not plan to provide further updates to any material once published and it is not under any obligation to keep this material up to date.
This material is short term in nature and may only relate to facts and circumstances existing at a specific time or day. Nothing in this material is (or should be considered to be) financial, investment, legal, tax or other advice and no reliance should be placed on it. No opinion given in this material constitutes a recommendation by FOREX.com or the author that any particular investment, security, transaction or investment strategy is suitable for any specific person.
The material has not been prepared in accordance with legal requirements designed to promote the independence of investment research. Although FOREX.com is not specifically prevented from dealing before providing this material, FOREX.com does not seek to take advantage of the material prior to its dissemination. This material is not intended for distribution to, or use by, any person in any country or jurisdiction where such distribution or use would be contrary to local law or regulation. For further details see our full non-independent research disclaimer and quarterly summary.