



What does todays escalation in Russian aggression mean for 4 key markets - Quick take
News reports that Putin has Authorised Special Military Operation in Ukraine’s Donbass has prompted a rapid repricing in risk assets and safe havens alike this afternoon.
Share this:

Reflecting mounting concerns over a full-scale Russian invasion of Ukraine following news reports this afternoon Putin has authorised special military operations in Ukraine’s Donbass, US equity futures have plunged through year-to-date lows. Elsewhere the Australian stock market has tumbled 3% to below 7000 for the first time since February 1.
In this article, we provide a quick take of where 4 key markets might trade to, should Russia invade all of Ukraine but with no NATO Military involvement. (the U.S has already said U.S. forces would not go into Ukraine). Should NATO troops enter Ukraine, it would exacerbate the moves outlined below.
1. The S&P500
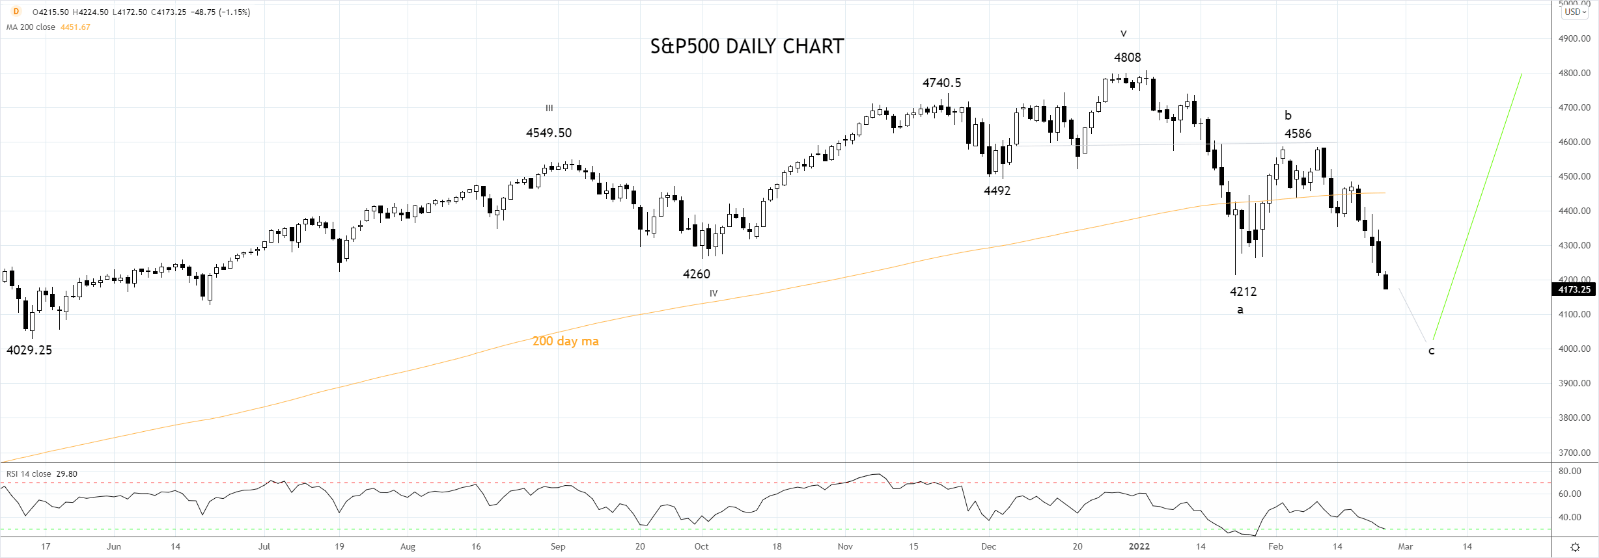
Last week the S&P500 rejected the 200-day moving average at 4450, which reinstated a short-term negative bias. After breaking the late January 4212 low during the Asian session today for fresh year to date lows, the risks are for the sell-off to extend another 5% lower towards wave equality at 4000 to complete a three wave corrective sequence from the 4808 high.
2. ASX200
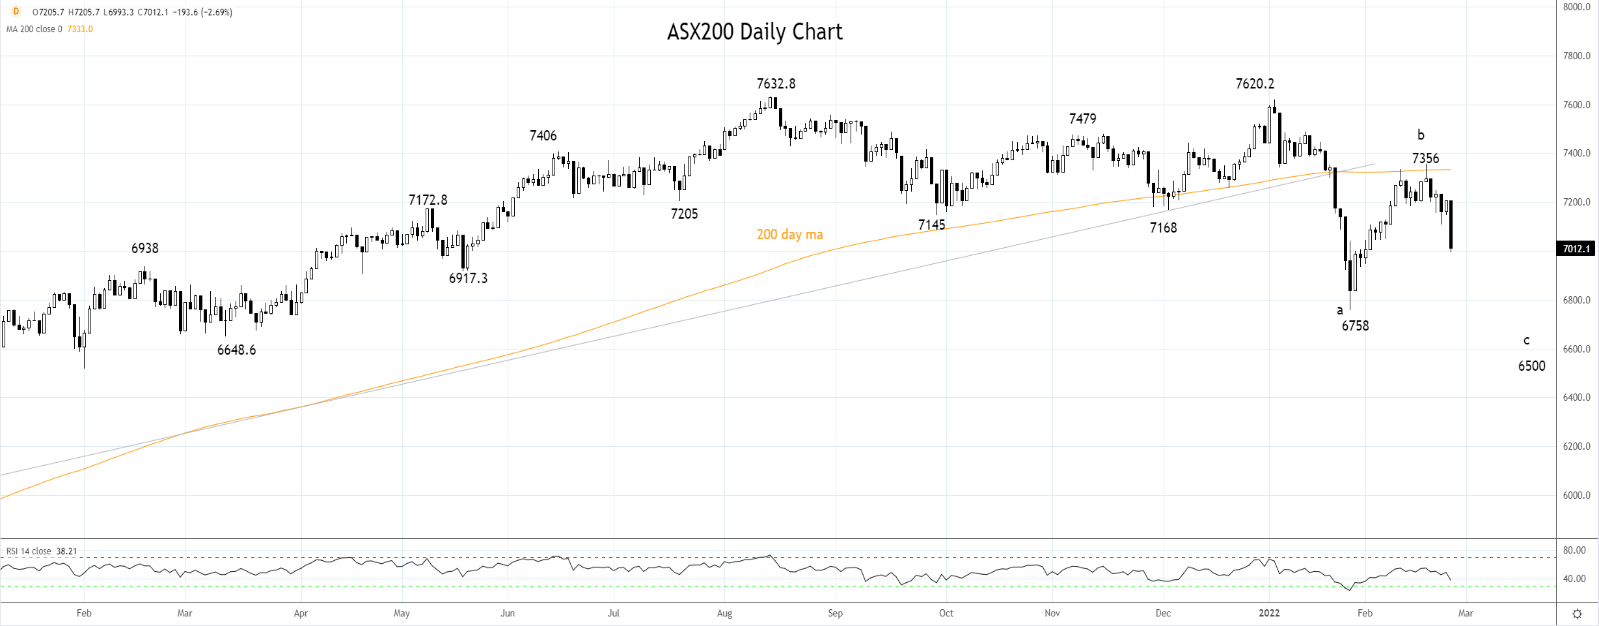
Extrapolating the 5% sell-off in the S&P500 into the ASX200 and bearing in mind the ASX200 is more defensive in nature which suggests it may outperform, the ASX200 has a pullback target of around 6650. The wave equality target is not until 6500. Ahead of both of those support levels and possible targets is the January 6758 low.
3. Gold
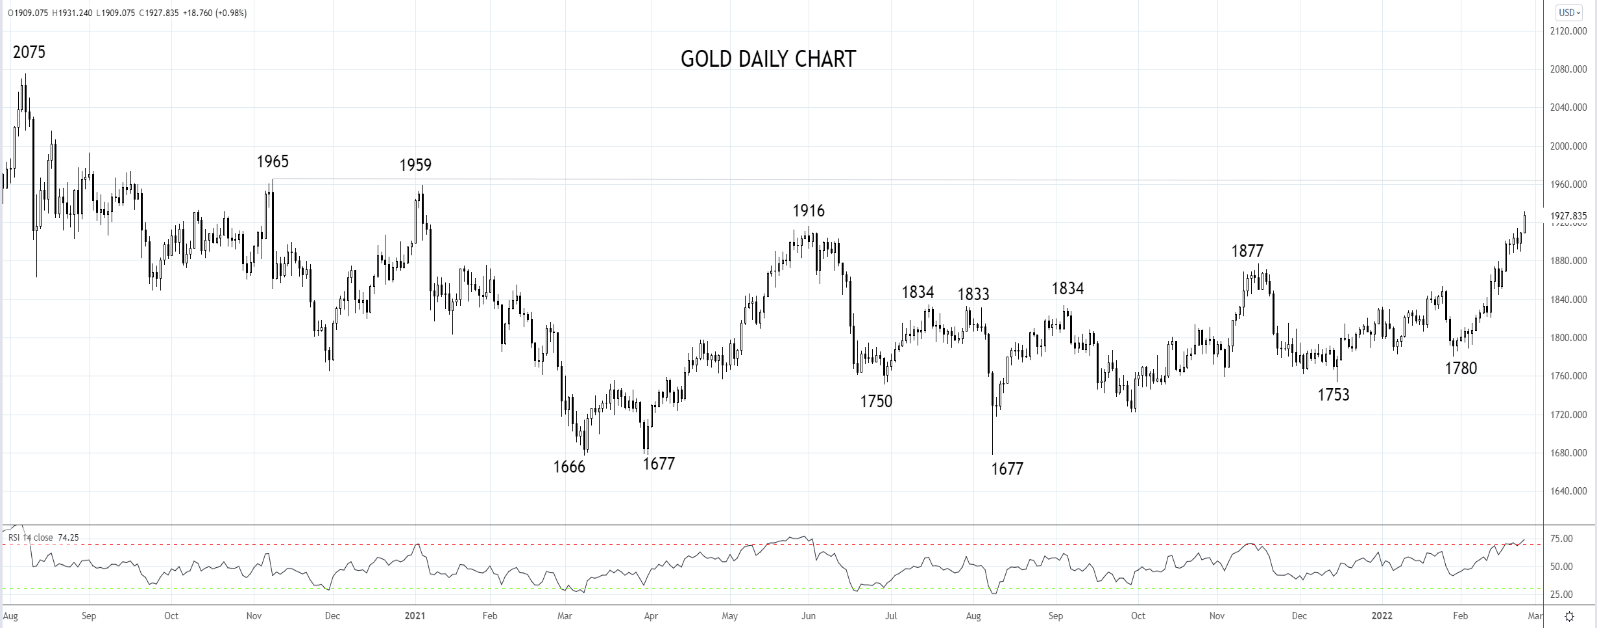
Gold has surged above resistance at $1916, and this should be the catalyst to see the move extend towards the next upside target at $1950/65. Beyond here, there is scope for the rally to retest the August 2020, $2075 high.
4. Crude Oil
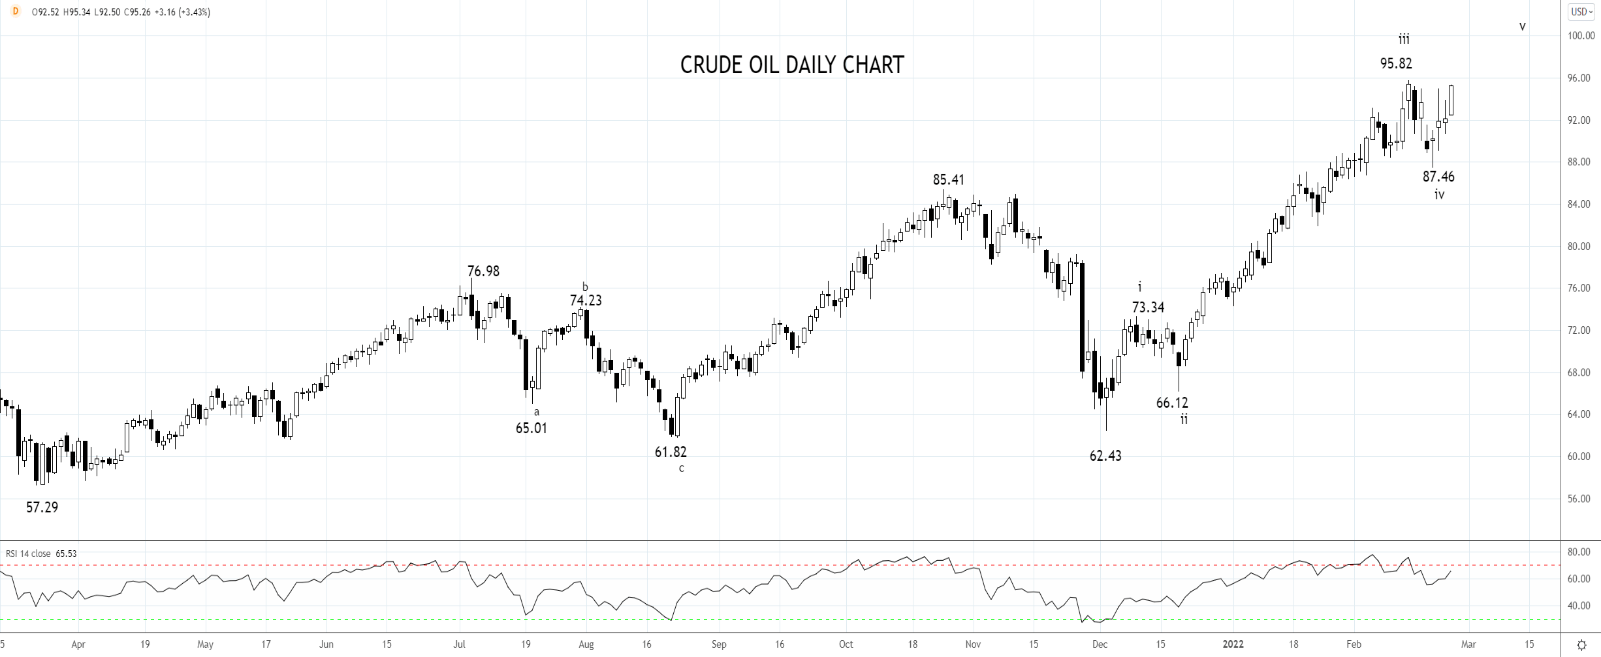
The combination of a tight market, new sanctions, and the escalation of Russian military activity in the Donbass region should be enough to see crude oil break above the $95.82 high and then above $100 per barrel, towards $102.00 in coming weeks.
Source Tradingview. The figures stated areas of Feb 24, 2022. Past performance is not a reliable indicator of future performance. This report does not contain and is not to be taken as containing any financial product advice or financial product recommendation
How to trade with City Index
You can trade with City Index by following these four easy steps:
- Open an account, or log in if you’re already a customer
• Open an account in the UK
• Open an account in Australia
• Open an account in Singapore
- Search for the company you want to trade in our award-winning platform
- Choose your position and size, and your stop and limit levels
- Place the trade
Reflecting mounting concerns over a full-scale Russian invasion of Ukraine following news reports this afternoon Putin has authorised special military operations in Ukraine’s Donbass, US equity futures have plunged through year-to-date lows. Elsewhere the Australian stock market has tumbled 3% to below 7000 for the first time since February 1.
In this article, we provide a quick take of where 4 key markets might trade to, should Russia invade all of Ukraine but with no NATO Military involvement. (the U.S has already said U.S. forces would not go into Ukraine). Should NATO troops enter Ukraine, it would exacerbate the moves outlined below.
1. The S&P500
Last week the S&P500 rejected the 200-day moving average at 4450, which reinstated a short-term negative bias. After breaking the late January 4212 low during the Asian session today for fresh year to date lows, the risks are for the sell-off to extend another 5% lower towards wave equality at 4000 to complete a three wave corrective sequence from the 4808 high.
2. ASX200
Extrapolating the 5% sell-off in the S&P500 into the ASX200 and bearing in mind the ASX200 is more defensive in nature which suggests it may outperform, the ASX200 has a pullback target of around 6650. The wave equality target is not until 6500. Ahead of both of those support levels and possible targets is the January 6758 low.
3. Gold
Gold has surged above resistance at $1916, and this should be the catalyst to see the move extend towards the next upside target at $1950/65. Beyond here, there is scope for the rally to retest the August 2020, $2075 high.
4. Crude Oil
The combination of a tight market, new sanctions, and the escalation of Russian military activity in the Donbass region should be enough to see crude oil break above the $95.82 high and then above $100 per barrel, towards $102.00 in coming weeks.
Source Tradingview. The figures stated areas of Feb 24, 2022. Past performance is not a reliable indicator of future performance. This report does not contain and is not to be taken as containing any financial product advice or financial product recommendation
- Open a Forex.com account, or log in if you’re already a customer.
- Search for the pair you want to trade in our award-winning platform.
- Choose your position and size, and your stop and limit levels.
- Place the trade.




Open an account in minutes
Experience award-winning platforms with fast and secure execution.
Economic calendar
Web Trader platform
Our sophisticated web-based platform is packed with features.
Related articles

Gold Price Short-term Outlook: XAU/USD Bears Face Critical Test at Yearly Lows 11 17 2026
Gold's decline is showing signs of exhaustion at major support, with a pivotal range break in focus ahead of the FOMC minutes.


Nasdaq 100 Forecast: NDX rises ahead of Nvidia earnings
U.S. stocks are pointing to a mixed open, with Nasdaq futures inching higher as recently battered tech stocks steady ahead of Nvidia's earnings after the close and Anthropic's highly anticipated IPO tomorrow. Investors are also digesting slower retail sales growth, while Fed speakers will be watched closely.


US Dollar, Gold, Silver Outlook: 2026 Extremes and Key Levels to Watch
US Dollar, Gold, Silver Outlook: Major currency pairs and precious metals are testing 2026 extremes as markets price in a 25-basis-point Fed rate hike in December. However, stretched momentum indicators are bringing near-term reversal risks into focus.

StoneX Financial Ltd (trading as "FOREX.com") is an execution-only service provider. This material, whether or not it states any opinions, is for general information purposes only and it does not take into account your personal circumstances or objectives. This material has been prepared using the thoughts and opinions of the author and these may change. However, FOREX.com does not plan to provide further updates to any material once published and it is not under any obligation to keep this material up to date.
This material is short term in nature and may only relate to facts and circumstances existing at a specific time or day. Nothing in this material is (or should be considered to be) financial, investment, legal, tax or other advice and no reliance should be placed on it. No opinion given in this material constitutes a recommendation by FOREX.com or the author that any particular investment, security, transaction or investment strategy is suitable for any specific person.
The material has not been prepared in accordance with legal requirements designed to promote the independence of investment research. Although FOREX.com is not specifically prevented from dealing before providing this material, FOREX.com does not seek to take advantage of the material prior to its dissemination. This material is not intended for distribution to, or use by, any person in any country or jurisdiction where such distribution or use would be contrary to local law or regulation. For further details see our full non-independent research disclaimer and quarterly summary.