Silver Surges to All-Time High- Breakout Confirmed with RSI
It was a strong year for metals with the entire block outperforming broader risk assets 2025. Year-to-date, Copper is up more than 30%, Gold has rallied more than 60% and Platinum surged more than 100%. The strongest performer was Silver with XAG/USD more than doubling into the close of the year. Demand remains strong, supported by its critical role in the rapidly expanding solar sector, medical applications, and modern electronics. The recent AI-driven rally has only amplified the importance of this metal across key industries. Although strength commodities was not unexpected, the sheer magnitude and breath of the silver advance highlights a core market truth: powerful uptrends can remain overbought far longer than many anticipate — often a hallmark of a healthy and persistent bullish phase. Here is a quick look at the anatomy of an overbought market.
Silver Price Chart – XAG/USD Monthly
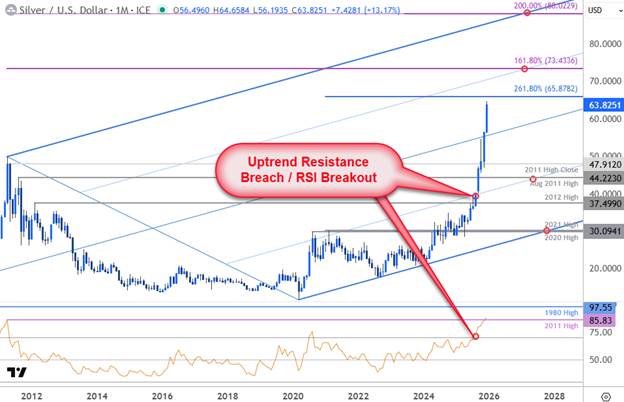
Chart Prepared by Michael Boutros, Senior Technical Strategist; XAG/USD on TradingView
Silver was a top performer in 2025 with XAG/USD rallying more than 120% as of late-December. The break above uptrend resistance in August was a flashpoint for the bulls with XAG/USD surging past the record high in the following weeks. The pivot in price was accompanied by a momentum breach above 70 with monthly RSI climbing to the highest level since the 2011.
While the break above resistance did keep the focus higher, the stretch towards overbought conditions left many “waiting for the pullback” for entry. Well, the pullback never materialized with momentum now firmly above 70 for a fifth-consecutive week. Can this rally keep going?

Silver Price Chart – XAG/USD Weekly
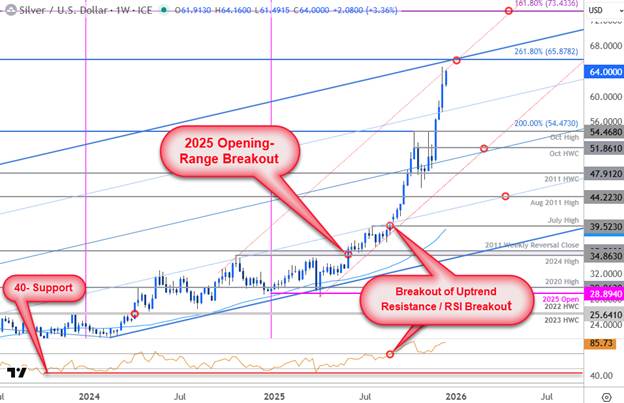
Chart Prepared by Michael Boutros, Senior Technical Strategist; XAG/USD on TradingView
A closer look at the weekly chart illustrates how the yearly rally unfolded. The 2025 opening-range took shape just below technical resistance at the 2024 swing high and the 2011 weekly reversal close at 34.86-35.58. A brief test of yearly-open support in April reversed sharply, with silver breaking through the 2025 opening-range in June.
Note that RSI did not break into overbought condition until August- that signal was accompanied with a breakout of uptrend resistance at the 25% parallel and the July high at 39.52. The subsequent move marked an eight-week rally into December with silver now approaching the upper bounds of this formation.
Key Take Aways
A few reminders to note here. First, a breakout into overbought conditions in relative strength can often be the largest and fastest stretch of a given advance- this is healthy in strong uptrends. The notion that the rally may be vulnerable because the advance is “overstretched” has misled many a trader. Remember, the indicator only tells you how much torque the rally has exhibited and should be viewed as a simple observation on the condition of an advance- a snapshot in time.
The second reminder is that there is no time value in this indicator- no predictive properties. RSI can remain in overbought territory and even signal divergence for an indefinite time-period. Note that the oscillator has been in overbought territory since August on both the weekly and daily timeframes. The bulk of the yearly rally happened as RSI was above 70. It is the break back below the 70-zone that typically signals the threat of exhaustion and waning momentum.
Another aspect to consider is that RSI behavior can also offer some insight on the state of a given trend. The oscillator will tend to hold above 40 in strong uptrends, and below 60 in strong downtrends. Silver’s relative strength has held above 40 since October of 2022- just months after the yearly lows were registered. Multiple stints into overbought found support ahead of 40 and the momentum profile has been constructive in Silver for the past two-years.
Bottom line: the relative strength is a useful tool—nothing more, nothing less. It should never supersede basic support and resistance. RSI is most powerful when a break of price levels is accompanied by extraordinary momentum, or when divergence emerges into key pivot zones to help identify potential exhaustion at support or resistance. These moments of alignment between price structure and momentum can provide greater conviction in the validity of a developing move. The key is to use the oscillator to confirm what price is already signaling—not the other way around. RSI has been a critical part of my process for years, but it belongs in its proper place: price dictates the break; RSI simply highlights the stakes.
Silver Price Outlook: The silver breakout is on its way towards uptrend resistance in one of the most impressive commodity rallies seen in years. The AI rally is likely to continue fueling growing demand for electronics and the broader outlook remains constructive heading into 2026 with momentum still in favor of the bulls.
That said, the rally may be vulnerable into the turn of the year and the immediate focus is on a reaction into the highlighted resistance confluence near 65.88 – threat for exhaustion / price inflection into this zone early in the year. Pullbacks should be limited t 51.86 IF price is heading higher on this stretch with a close above the upper parallel needed to fuel the next major leg of the advance. Subsequent resistance objectives are eyed at the 1.618% extension of the 2011 decline at 73.43 and the 200% extension at 88.
--- Written by Michael Boutros, Senior Market Analyst
Follow Michael on X @MBForex