


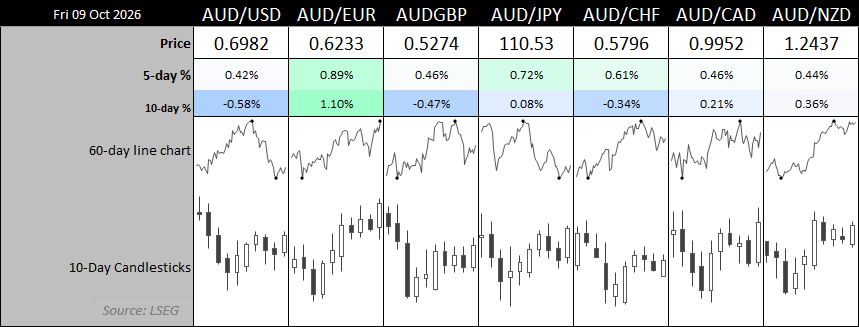
AUD/USD snapped a four-week losing streak, but its modest rebound faces a busy week of economic data and geopolitical risks. Rising oil prices and Middle East tensions threaten risk appetite, while RBA minutes, Australian employment figures and US CPI could reshape interest rate expectations. With the US dollar rally stalling and speculative Aussie shorts at record highs, traders face the prospect of a deeper AUD/USD recovery or renewed selling pressure.
View related analysis:
- Gold Bears Approach Major Support, USD/CHF Eyes Reversal
- USD/CAD Knocked from Its Perch as US Dollar Rally Pauses for Breath
- Australian Dollar Outlook: AUD/USD Bears to Face Near-Term Reprieve?
- Crude Oil Outlook: WTI Holds Support as Brent Shows Strength
- AUD/USD Q4 Outlook: RBA and Fed Hikes Set the Tone
- How to Read the COT Report to Track Forex Market Sentiment
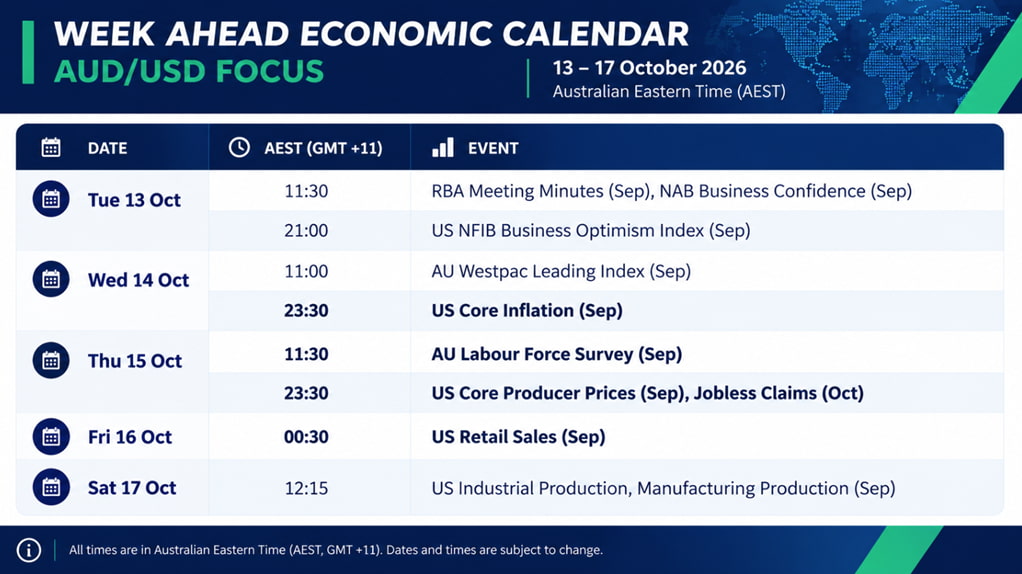
Australia This Week: Economic Data and Events for AUD/USD Traders
Middle East Tensions Pose Further Downside Risks for AUD/USD
Middle East tensions remain a major external risk for AUD/USD after Iran-backed Houthi attacks on Saudi Arabia escalated over the weekend, including a deadly strike on Riyadh’s international airport.
Higher oil prices and weaker risk sentiment are a potentially bearish combination for the risk-sensitive Aussie, particularly if further attacks on Saudi infrastructure or shipping routes lift inflation expectations and US Treasury yields.
This content was created by an affiliate of FOREX.com and represents the views and opinions of the author/speakers, not the views and opinions of FOREX.com, StoneX Group Inc., or its subsidiaries. The content has not been independently reviewed by FOREX.com.
RBA Minutes and Australian Jobs Data Could Shape Rate Expectations
The RBA maintained a hawkish bias when it recently raised the cash rate to a 15-year high of 4.6%. Expectations for a more aggressive move eased after Bullock confirmed the debate was between holding and a 25bp hike, rather than between a 25bp and 50bp hike.
This week’s minutes could reveal how finely balanced that decision was, and how much emphasis members placed on energy prices, weak productivity and the AI-related investment boom as persistent inflation risks. That could help traders gauge how concerned the RBA is about second-round inflation effects and the need for further tightening.
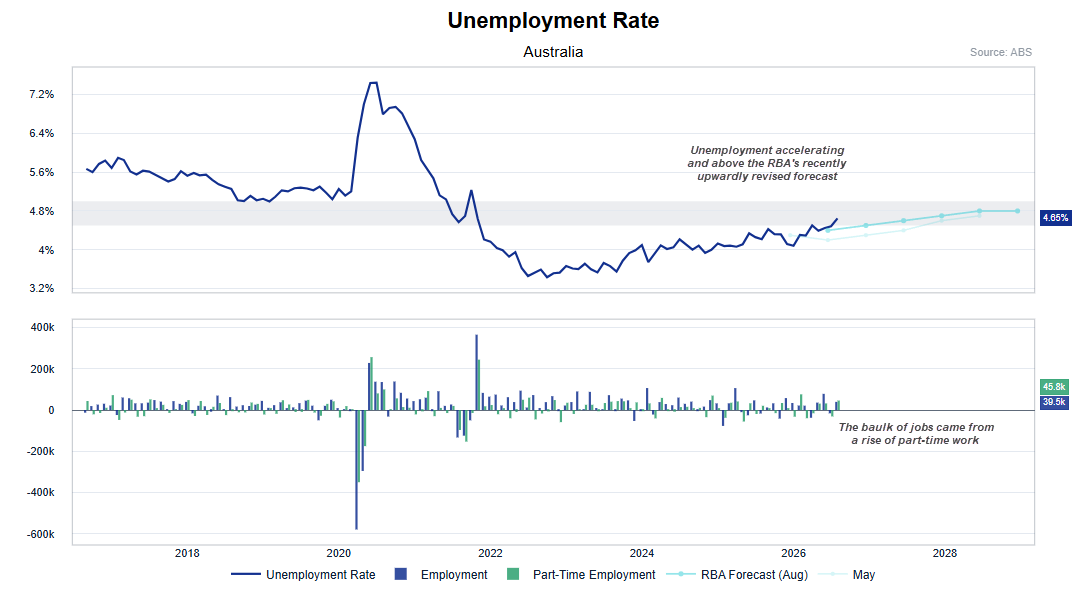
The labour force report could also help fine-tune those policy expectations. The unemployment rate has already risen above the RBA’s most recent forecast, and the pace of its increase has accelerated. Meanwhile, recent employment growth was driven by part-time jobs, while full-time employment declined.
Source: ABS, RBA

US CPI and Retail Sales Risk Being Overshadowed by Oil Prices
US inflation data for September is the main calendar event from the US this week, with retail sales a close second. But with oil prices surging and Middle East headlines once again dominating, both releases risk being overshadowed if tensions escalate further and crude continues higher.
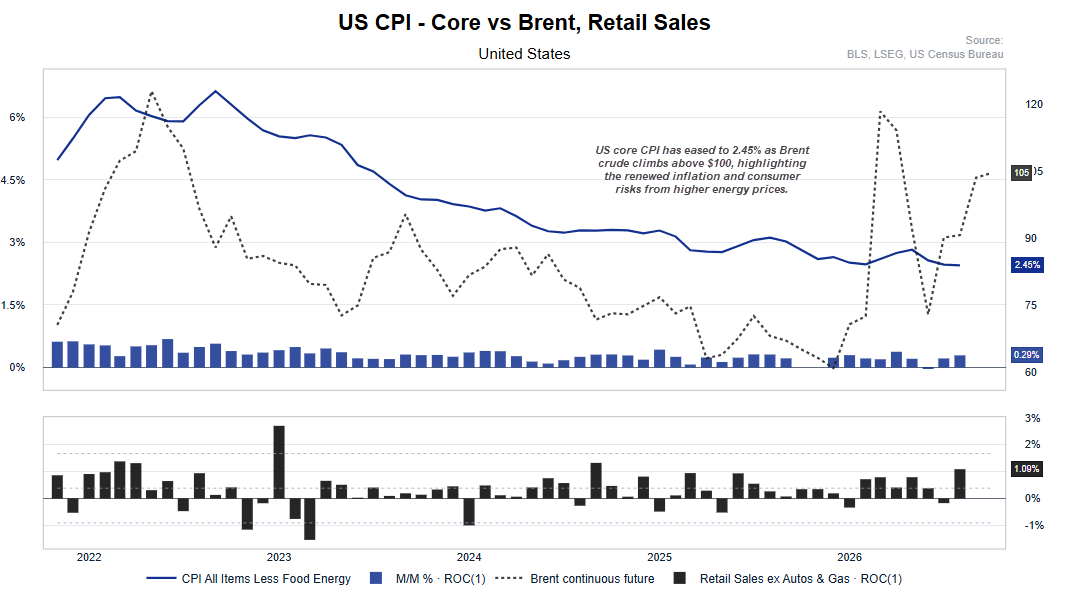
Core CPI is trending lower, but there is no avoiding the pressure that higher energy prices place on consumers and inflation expectations. That is particularly relevant after the latest University of Michigan survey showed consumer sentiment falling close to a record low, while one-year inflation expectations rose to 4.7%.
Retail sales surprised to the upside in August, but this week’s data could play second fiddle to oil if Brent continues to climb. With crude prices responding in real time to geopolitical developments, the energy shock may prove more important for near-term Fed expectations than backward-looking September data.
Source: BLS, CB, LSEG, NYMEX
AUD/USD Technical Analysis: Australian Dollar vs US Dollar
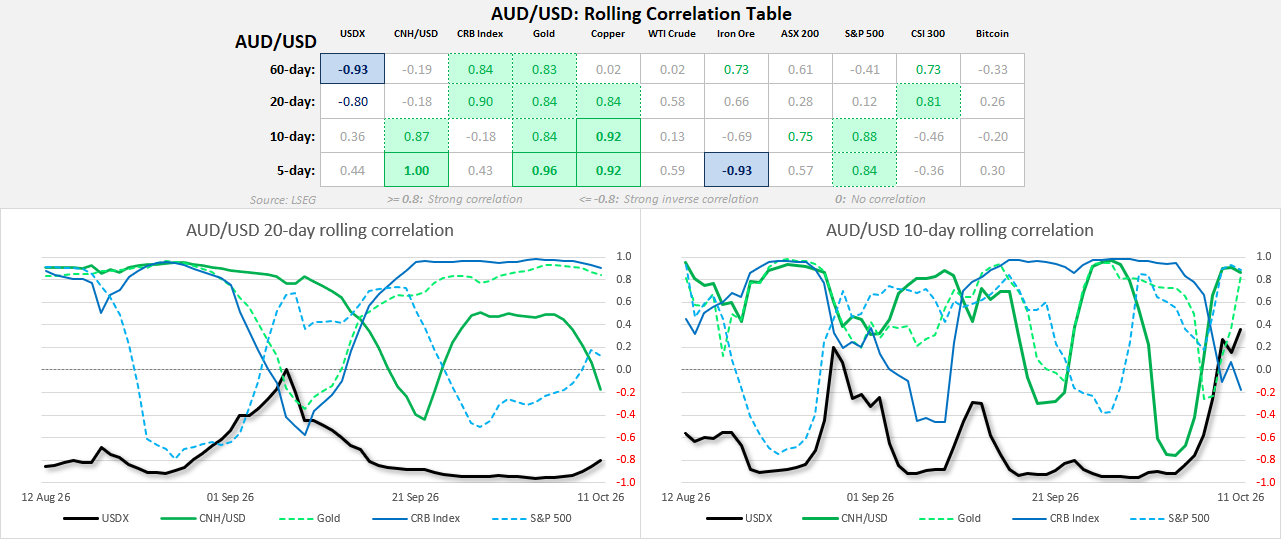
AUD/USD Correlations
- US dollar: The strong inverse correlation with DXY remains intact over 20 and 60 days (-0.80 and -0.93), although the relationship has temporarily broken down over shorter periods.
- Risk sentiment: Correlations with the S&P 500 have surged over 5 and 10 days (0.84 and 0.88), suggesting the Aussie is increasingly sensitive to swings in risk appetite.
- Commodities: Copper and gold show strong positive correlations over 5 and 10 days, while iron ore has turned sharply negative. Copper and gold currently offer more useful confirmation.
- Chinese yuan: The CNH relationship has strengthened considerably, reaching 0.87 over 10 days and 1.00 over five days, making USD/CNH worth watching for near-term AUD/USD direction.
Source: LSEG
AUD/USD Futures Positioning | COT Report
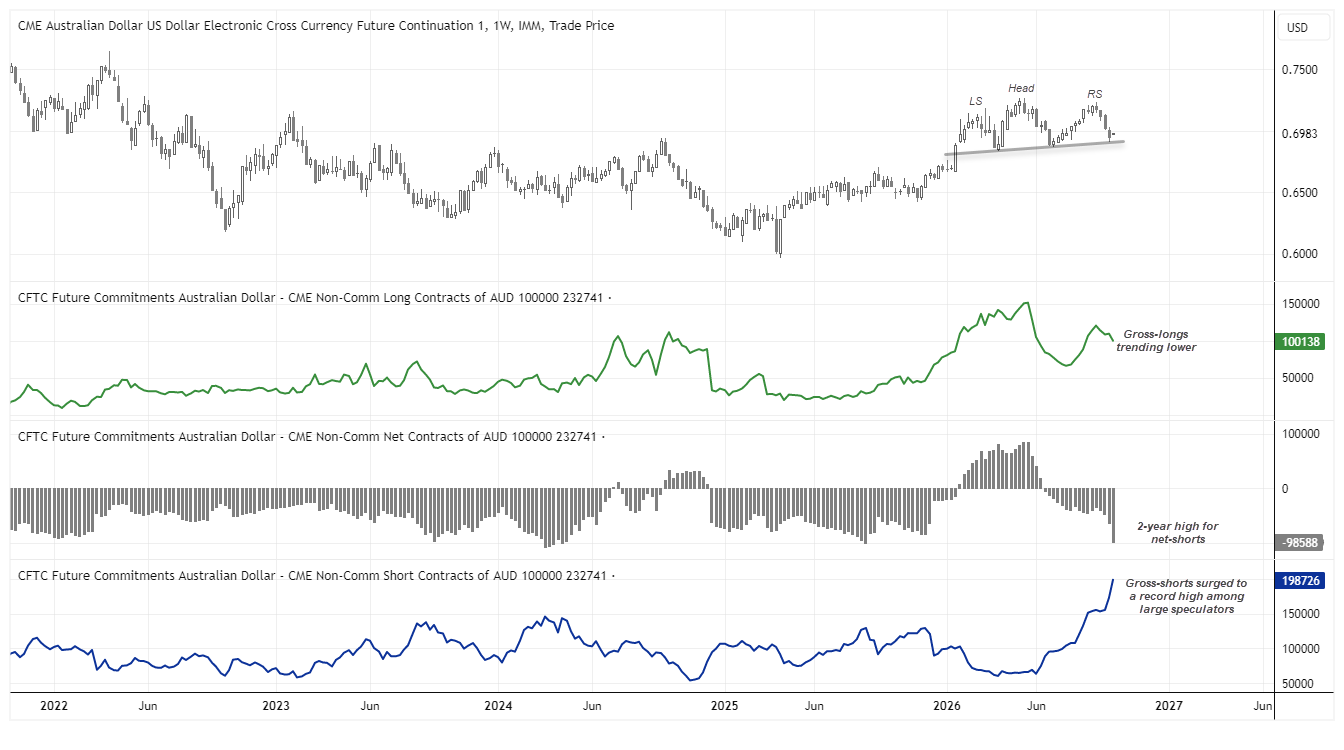
Not only have AUD/USD bears been proven right in the futures market, but they are embracing the move. Gross shorts have surged to a record high among large speculators, after they defiantly shorted the Aussie throughout July and August despite rising prices at the time. Rising shorts alongside falling longs have pushed net shorts to a two-year high of 98.6k contracts.
However, we may be approaching a sentiment extreme, so bears may want to tread with caution, especially while prices remain above the neckline of a potential head and shoulders top. If successful, the pattern projects a target around 65c, though it may require a much stronger US dollar and prices need to break lower very soon.
Source: CFTC (COT) CME, LSEG
AUD/USD Options and Volatility Analysis (Risk Reversals, HVN Levels)
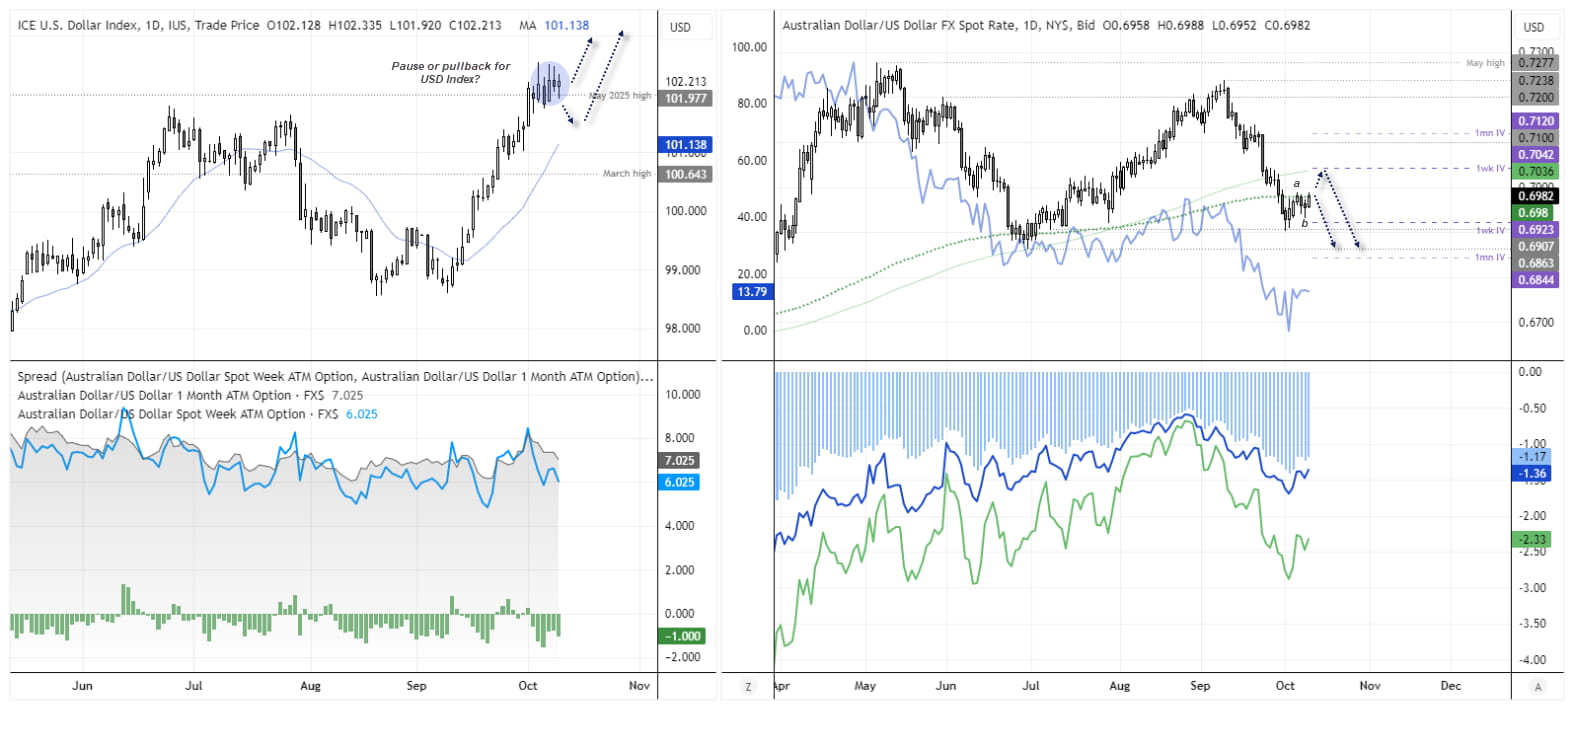
The Aussie snapped a four-week losing streak, though its bullish inside week was hardly an epic rebound. But with the US dollar rally stalling around its cycle highs, AUD/USD appears to be forming an ABC correction – and it seems we're now within wave ‘C’. Should risk appetite improve or US CPI surprise to the downside, we may finally see the US dollar retracement I have been waiting for.
However, the 200-day EMA is currently acting as resistance, with 70c also nearby to potentially cap any stronger rally. Note that the 200-day EMA also sits near the upper one-week implied volatility band, which has narrowed for a third consecutive week.
The US dollar rally has stalled but is yet to retrace, and failure to do so could limit AUD/USD gains. While the AU-US 2-year yield spread and risk reversals have moved higher alongside AUD/USD, they are simply confirming a shallow retracement rather than providing strong clues of an impending rally.
Ultimately, I suspect bears may be looking to fade moves towards the 200-day EMA.
Source: ICE, TradingView






