


- Brent crude jumps over 4%, helping drive a sharp USD reversal
- US jobless claims fell to 207k, reinforcing firm labour market conditions
- AUD/USD flashed a shooting star with .7158 now the key level to watch
- NZD/USD printed a bearish key reversal with the 50DMA in focus
Crude and claims spark USD bounce
Reversal patterns emerged across several major dollar pairs on Thursday, including AUD/USD and NZD/USD, as a fresh lift in crude oil futures and another solid US labour market report helped swing momentum back towards the greenback.
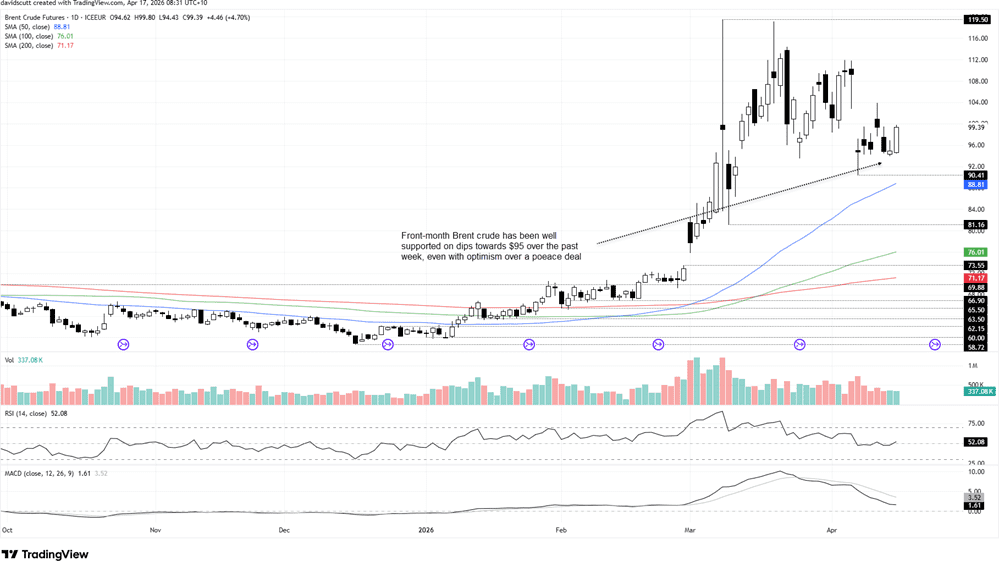
The initial catalyst came from a Bloomberg report citing unnamed Gulf Arab and European officials suggesting a US-Iran peace deal may take around six months to finalise, with the current ceasefire ideally extended across that period. That was enough to send Brent crude more than 4% higher as markets again tried to price how long disruptions through the Strait of Hormuz may persist. The reality is nobody knows. Not the officials, not the market, nobody. But with traders hypersensitive to any headline tied to timing, even finger-in-the-air speculation is still proving enough to generate sharp moves in energy markets. That's telling.
Source: TradingView
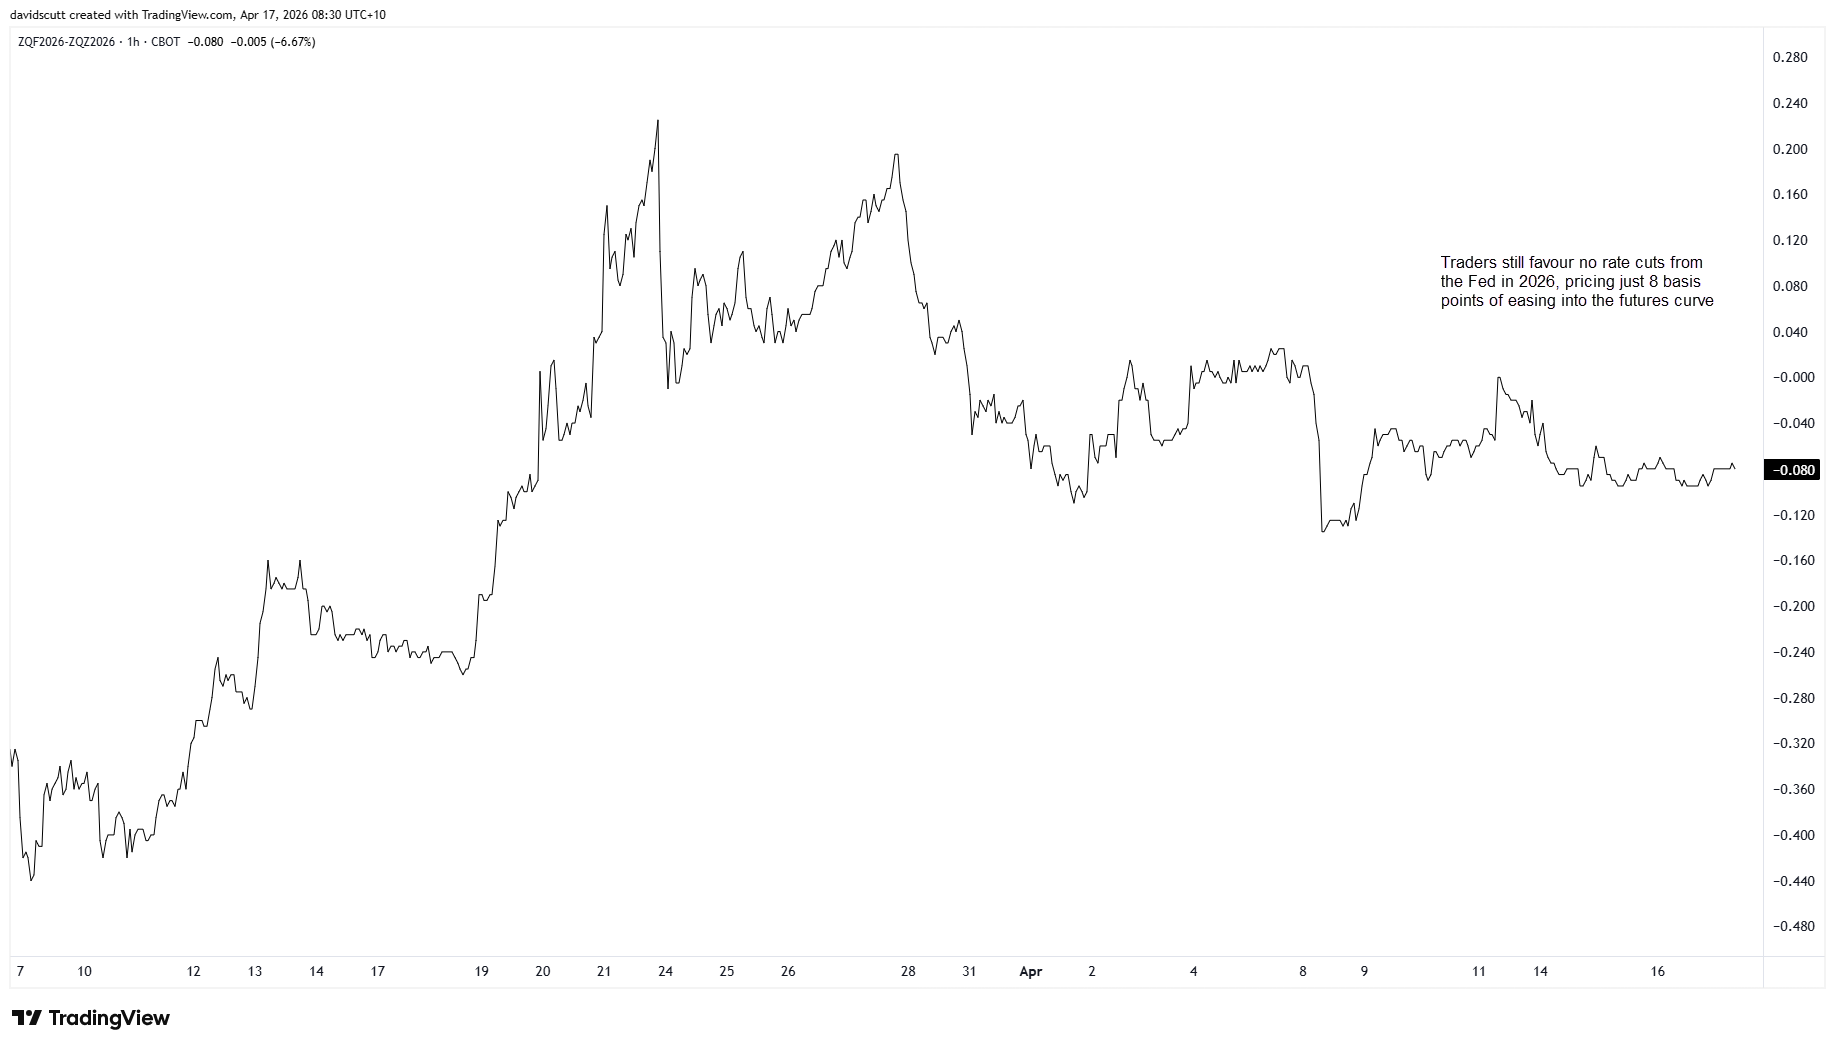
With crude already squeezing higher on the headlines, firm US labour market figures arrived at the perfect time to add fresh support to the dollar reversal. Weekly jobless claims came in at just 207,000, down 11,000 from a week earlier and well below the median economist forecast of 215,000, reinforcing the message that US labour market conditions remain firm. With higher energy prices still working their way through supply chains to consumers, traders now see little scope for the Fed to ease policy aggressively this year, with futures markets pricing only around 8 basis points of rate cuts by year-end.
Source: TradingView
That, combined with renewed supply concerns for net energy importers, helped trigger numerous reversal patterns across major dollar pairs. Many arrived after prolonged trends, strengthening the technical case behind them, but the underlying energy catalyst was flimsy at best, raising valid questions over how much trust to place in the moves when run through a fundamental filter.
Shooting star warns of Aussie downside
Source: TradingView
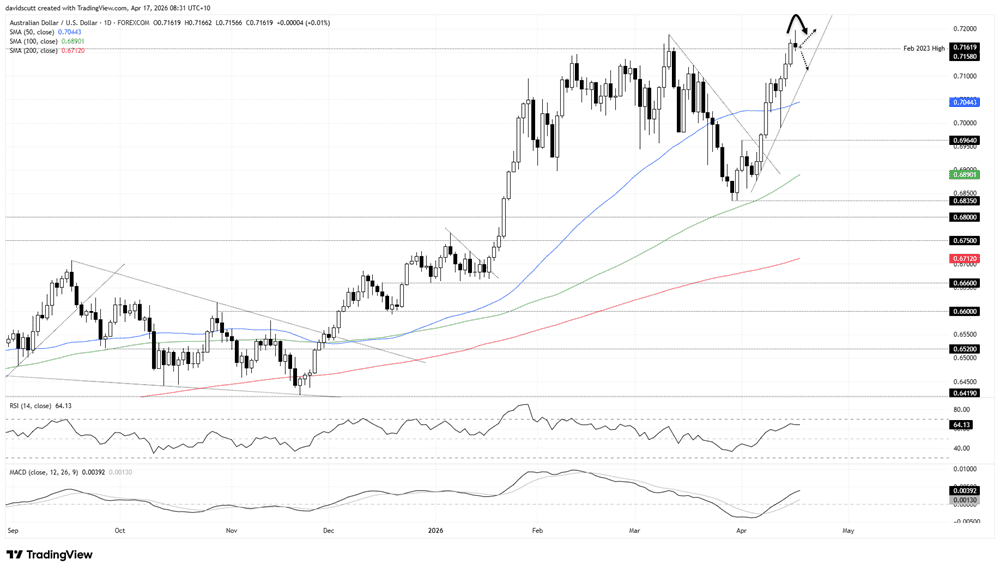
For AUD/USD, we've seen a clear shooting star following a lengthy bullish run since early April, with the strength of the signal enhanced further by the fact it arrived from a known reversal zone. There were three failed bullish breakout attempts above the February 2023 swing high of .7158 during March, and while the pair managed to close above it on this occasion, the follow-up price action is not building confidence this one will stick either.
Therefore, .7158 is the level to watch today. A clean break beneath it will allow for shorts to be set with a tight stop above for protection, targeting either .7100, the April uptrend or 50-day moving average, depending on desired risk reward. But if the price can hold above .7158, the setup could be flipped with longs set above the level with a stop below, targeting Thursday's high just shy of .7200 initially and, beyond that, .7283.
Risk sentiment has been the primary driver of the aussie's recent ascent, rather than yield differentials or direct energy price fluctuations, so it will be important when assessing either setup. The message from the oscillators still favours buying dips and bullish breakouts at this stage, with RSI (14) grinding higher above 50 while MACD remains firmly in positive territory having crossed the signal line earlier this month.
Kiwi reversal puts 50DMA in play
Source: TradingView
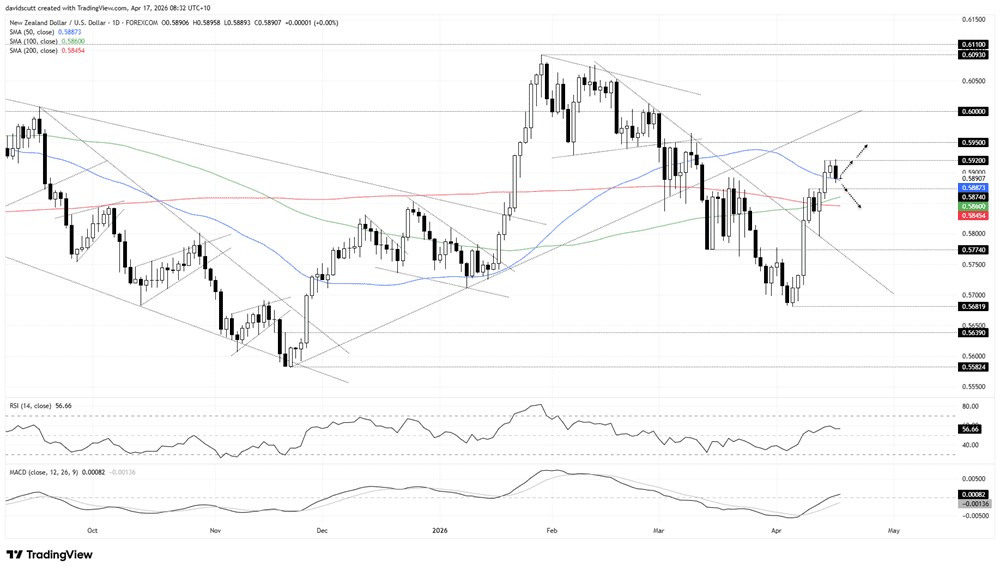
Like the Aussie, NZD/USD also delivered a clear reversal pattern on the daily timeframe, completing a bearish key reversal, engulfing the prior day's candle with a higher high and higher low. Coming after a prolonged bounce and having failed on three consecutive occasions to run over offers parked above .5920, it feels like we may have arrived at at least a short-term turning point.
The 50-day moving average is the downside level to watch on Friday. While the pair traded straight through it like it wasn't there back in the early stages of the Iran war, that was a unique headline-driven period. When you look at its interaction in more normal market conditions, the price often respects the 50, so it could be used for setup construction today.
If the bearish signal proves accurate, shorts could be set on a move beneath the 50 with a tight stop above, targeting .5874 initially, with the 200-day moving average a tougher hurdle for bears below. Should the 50DMA hold, longs could be set with a stop beneath for protection, targeting .5920. If offers above that level are overcome, .5950 and .6000 are the next topside targets for consideration.
The message from RSI (14) and MACD is more neutral than anything, with the upside strength showing signs of rolling over despite remaining marginally in bullish territory.






