


Although Bitcoin has started the week with a modest rebound, the asset is still down more than 11% over the last four trading sessions and, for now, price has been unable to reclaim the $80,000 level. Selling pressure continues to dominate overall market behavior, as demand for Bitcoin has yet to stabilize and capital outflows remain significant in the short term. In addition, market confidence remains in a state of indecision, and as long as these conditions persist, the bearish bias is likely to continue shaping short-term price action.

Bitcoin demand remains weak in the short term
Recent sessions have been particularly challenging for Bitcoin, as an environment of indecision in crypto demand has taken hold, partly driven by the strengthening of substitute assets, most notably the U.S. dollar. This has resulted in a sustained reduction in capital flows supporting consistent demand for Bitcoin.
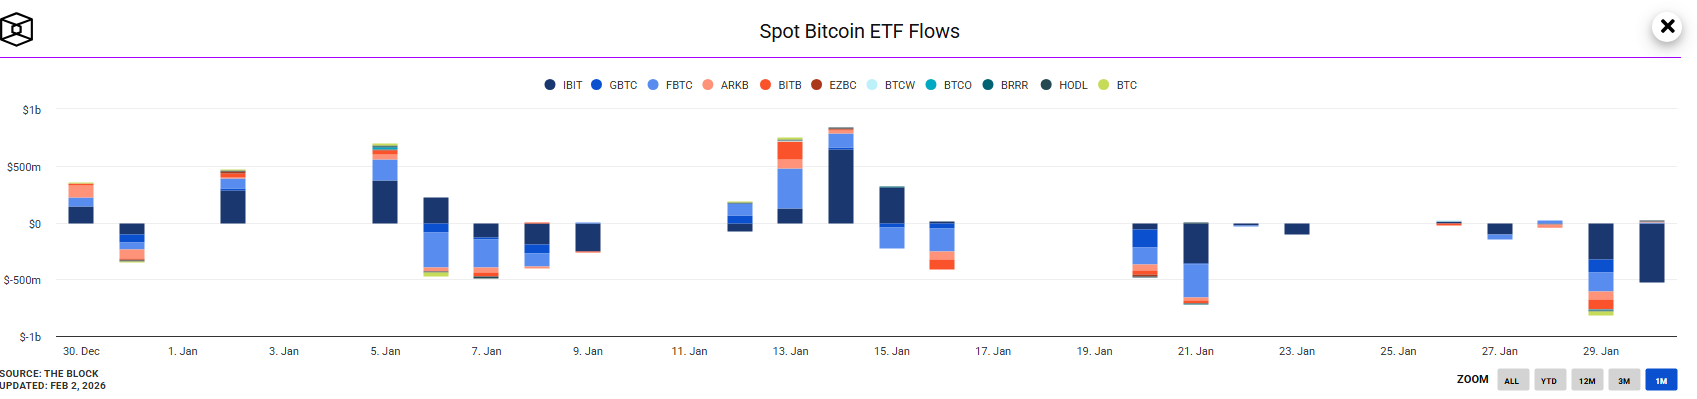
This dynamic is clearly reflected in Bitcoin ETF net flows, which as of January 30, 2026, recorded institutional outflows of $528 million, following an even larger $817 million outflow the previous session. These figures point to a sharp contraction in institutional appetite, with very limited new inflows, suggesting that crypto demand has struggled to hold up amid the dollar’s recent strength.
Fuente: Theblock
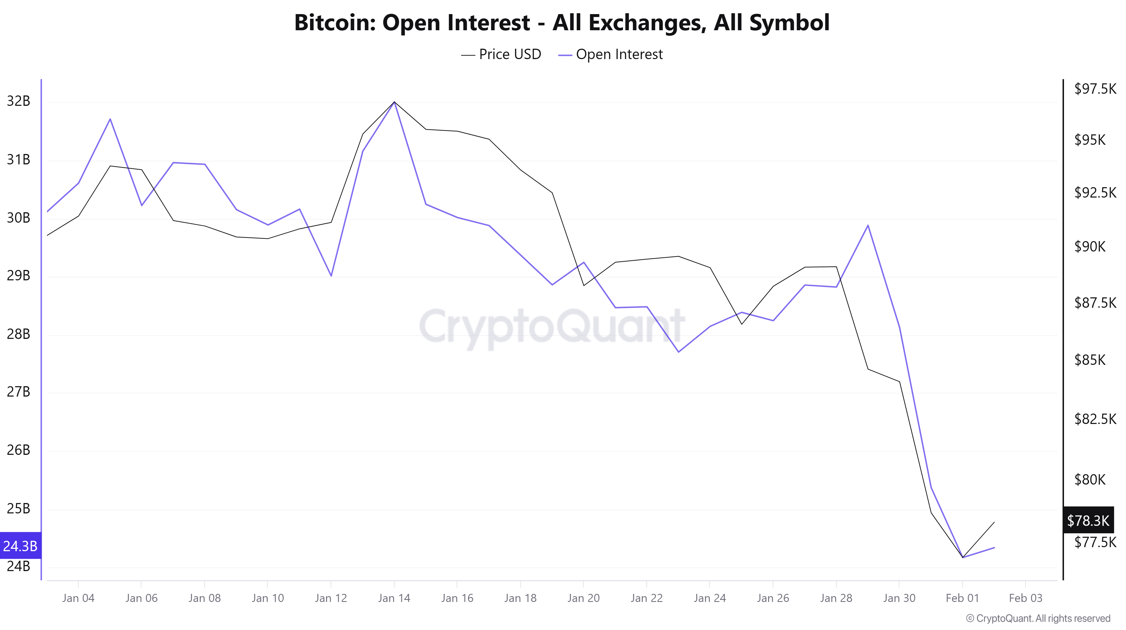
Weaker demand is also evident in the behavior of open interest, the indicator that measures total open long and short positions in the market. Over recent sessions, open interest has fallen sharply, dropping from $29.8 billion to levels near $24 billion, a decline not seen for several months. Combined with Bitcoin’s price drop, this move suggests a consistent exit of long positions, reflecting forced liquidations or capital rotating toward markets perceived as more attractive.
Fuente: Cryptoquant
Taken together, these factors suggest that a new phase of declining risk appetite has taken hold in the crypto market. While Bitcoin has shown a mild bounce at the start of the week, the persistent outflow of capital and long positions continues to weigh on confidence, potentially sustaining dominant selling pressure in the sessions ahead.
Market confidence continues to deteriorate
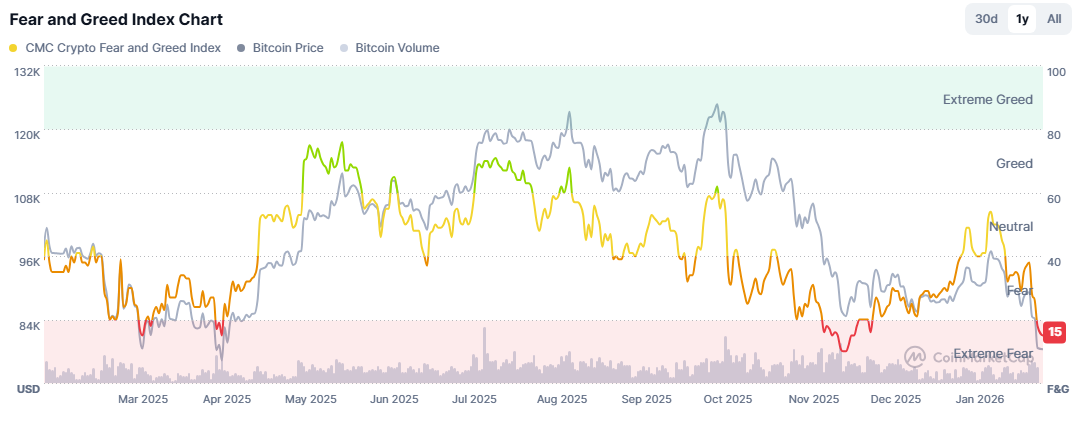
Crypto market sentiment has also weakened significantly. The Fear and Greed Index has shown a steady decline in recent sessions and is currently hovering around 15 points, firmly within “extreme fear” territory. This level reflects very fragile confidence and an environment that is unfavorable for a near-term recovery in demand.
Fuente: Coinmarketcap
As long as confidence indicators remain in extreme fear, it will be difficult to sustain an environment supportive of consistent Bitcoin demand. This condition may delay any meaningful recovery attempt and keep the bearish bias dominant, as it has yet to fully fade from the market.
Bitcoin Technical Outlook
Source: StoneX, Tradingview
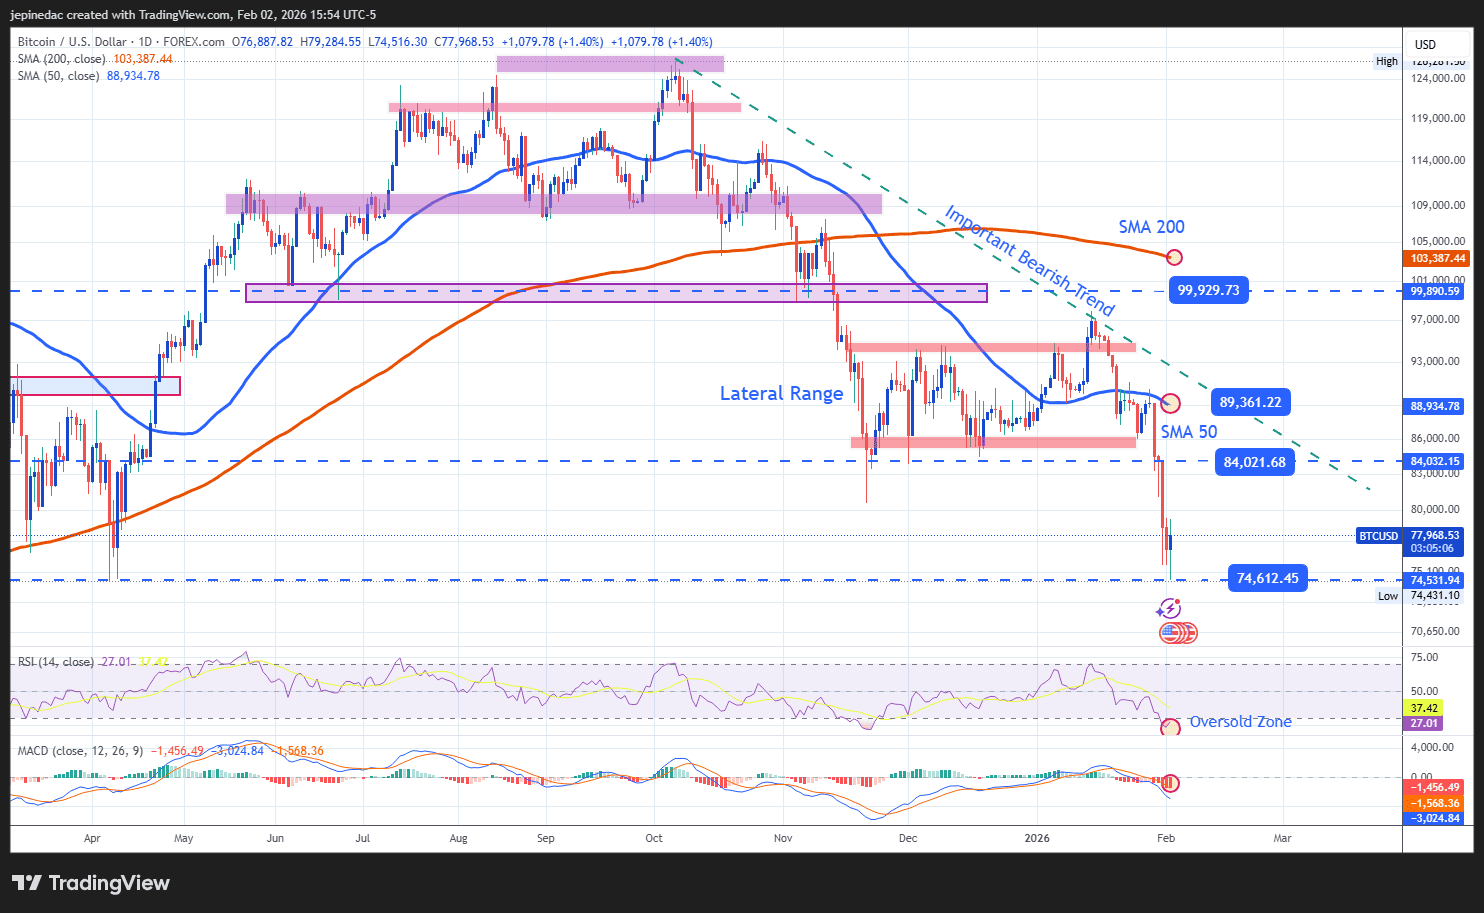
- The bearish trend regains relevance: Since October 2025, a downward trendline has been developing on Bitcoin’s daily chart. The recent price weakness has restored the relevance of this structure, which currently remains the dominant technical pattern. If Bitcoin continues to post new relative lows, this bearish trend could become even more aggressive in the coming sessions.
- RSI: The RSI remains below the neutral 50 level, confirming the dominance of bearish momentum. However, the indicator has dipped below the oversold threshold (30), suggesting a possible excess of selling pressure and leaving room for short-term technical rebounds, such as those seen at the start of the week.
- MACD: The MACD continues to reflect a bearish bias, with the histogram holding below the zero line. This indicates that selling pressure in short-term moving averages remains relevant. While technical rebounds may occur, there are no clear signs of strength capable of threatening the current downtrend.
Key levels:
- $89,361 – Key resistance: This area aligns with the 50-period simple moving average and the bearish trendline. A sustained move toward this level could put the bearish structure at risk and enable a more meaningful bullish bias.
- $84,021 – Nearby barrier: A recent neutral zone, which could serve as a reference level for stronger short-term corrective moves.
- $74,612 – Definitive support: A level not seen since April 2025, now standing as the most relevant downside barrier. A sustained break below this zone could trigger an acceleration of the bearish trend in the sessions ahead.
Written by Julian Pineda, CFA, CMT – Market Analyst
Follow him on: @julianpineda25






