


Small sample sizing is a dangerous thing in technical analysis because it can be attractive and even inducing, to look at something that’s happened a few times and expecting it to happen again. And then, when it doesn’t happen, it seems that all hope is lost and suddenly sentiment sours. That’s what seems to be the case around the Bitcoin halving and when BTC/USD dropped down to 65k in February, sentiment was persistently negative.
But in March began a simple case of deduction – even as many markets from gold to stocks sold off with aggression – Bitcoin held its own, grasping at support around the 65k level. And so far in April, bulls are making a move, driving towards the 80k level and giving the appearance that recovery may be in store.
As I highlighted on Monday, that recovery is still in the early stages but so far, since that article, bulls have continued to push higher from a higher-low and today brings yet another fresh breakout with a new two-month high.
There’s a Fibonacci retracement that I wanted to highlight on this weekly chart, spanning from the pandemic low of 3850 up to the high last year around 125k. It’s the 50% mark of that move that was defended multiple times as support, including a shorter-term series of higher-lows that we’ll look at in a moment. We’re now fast approaching re-test of the 38.2% retracement of that same major move which plots at 79,507.
Bitcoin (BTC/USD) Weekly Price Chart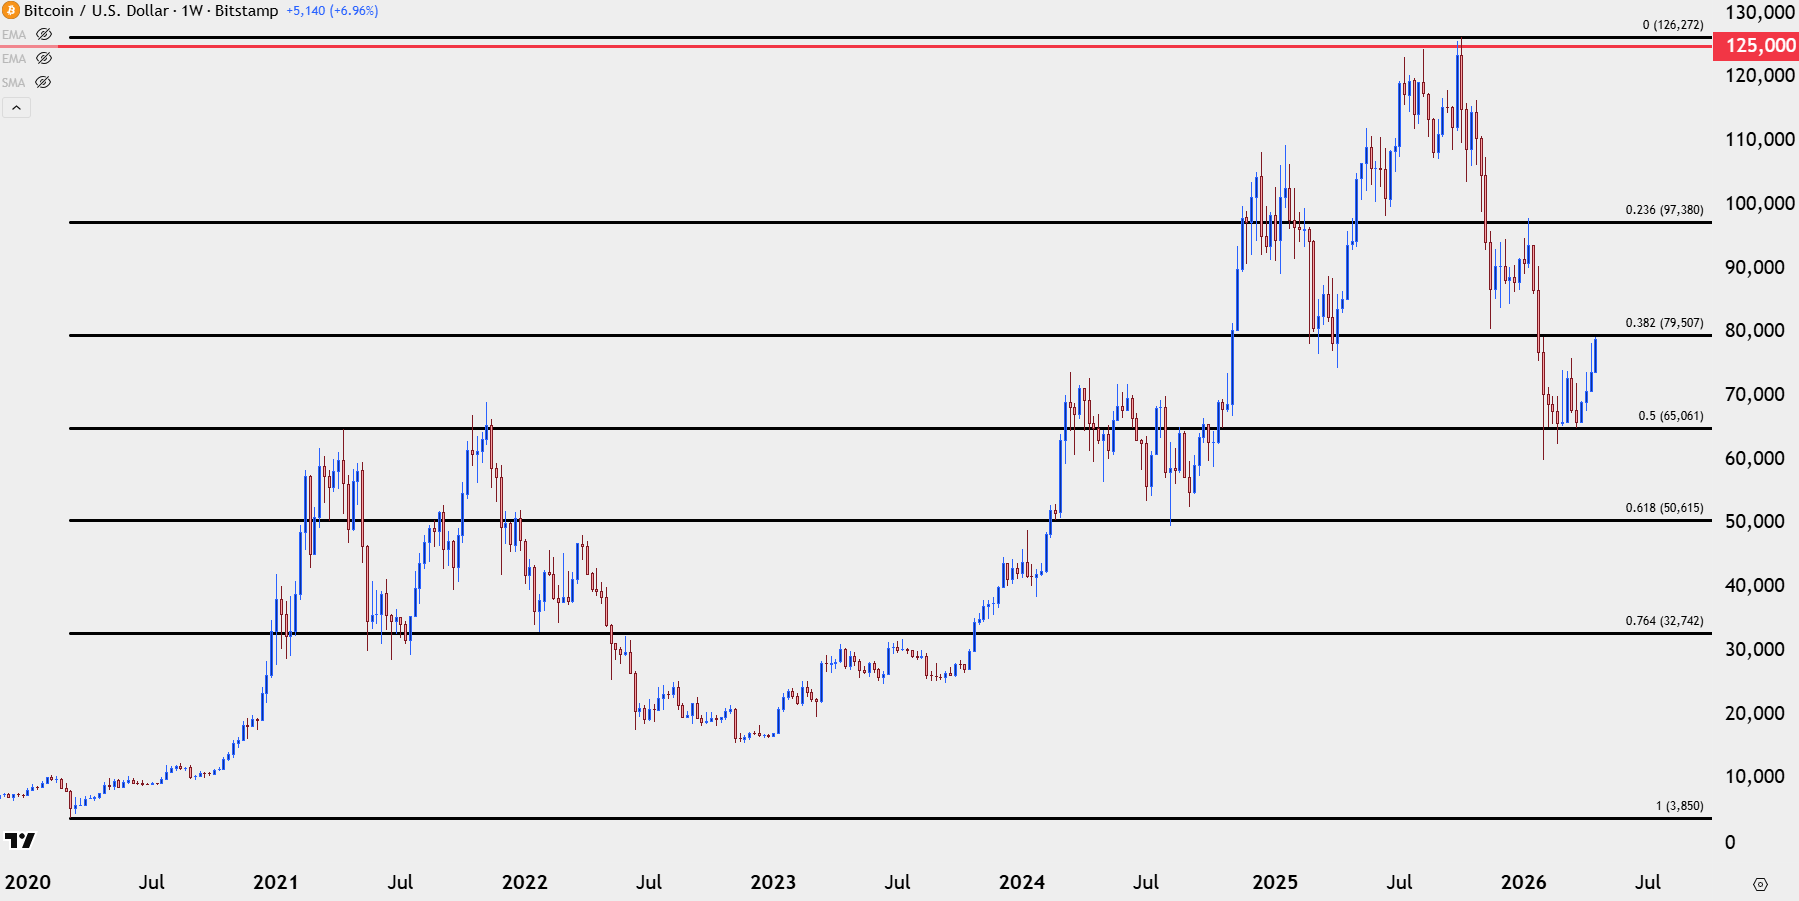
Chart prepared by James Stanley; data derived from Tradingview
Bitcoin Building a Turn
It took almost two months but a big tug-of-war developed at that 65k level, which built a series of higher-lows that eventually came to life in the month of April. Initially, there was resistance at the shorter-term 23.6% retracement of 75,587, but over the past two weeks buyers have grinded through that, continuing the series of higher-lows until this morning’s breakout and higher-highs.
We’re now getting close to a test of that longer-term Fibonacci level at 79,507, and above that, we have the 80k level which is one of those notable major psychological levels that often takes Bitcoin some time to work through.
For bulls, this can be considered more of a feature than a bug, however, as selling from or around 80k could lead to short-term pullback, which can then open the door for bullish trend setups.
Also notable and sitting overhead is a prior support swing at 80,537, and collectively, this can set up a resistance zone where the rally can rest, and a hold there wouldn’t necessarily be considered a trend changer as much as a ideal spot for longs to take profits after a consistent three-week-run.
Bitcoin (BTC/USD) Daily Price Chart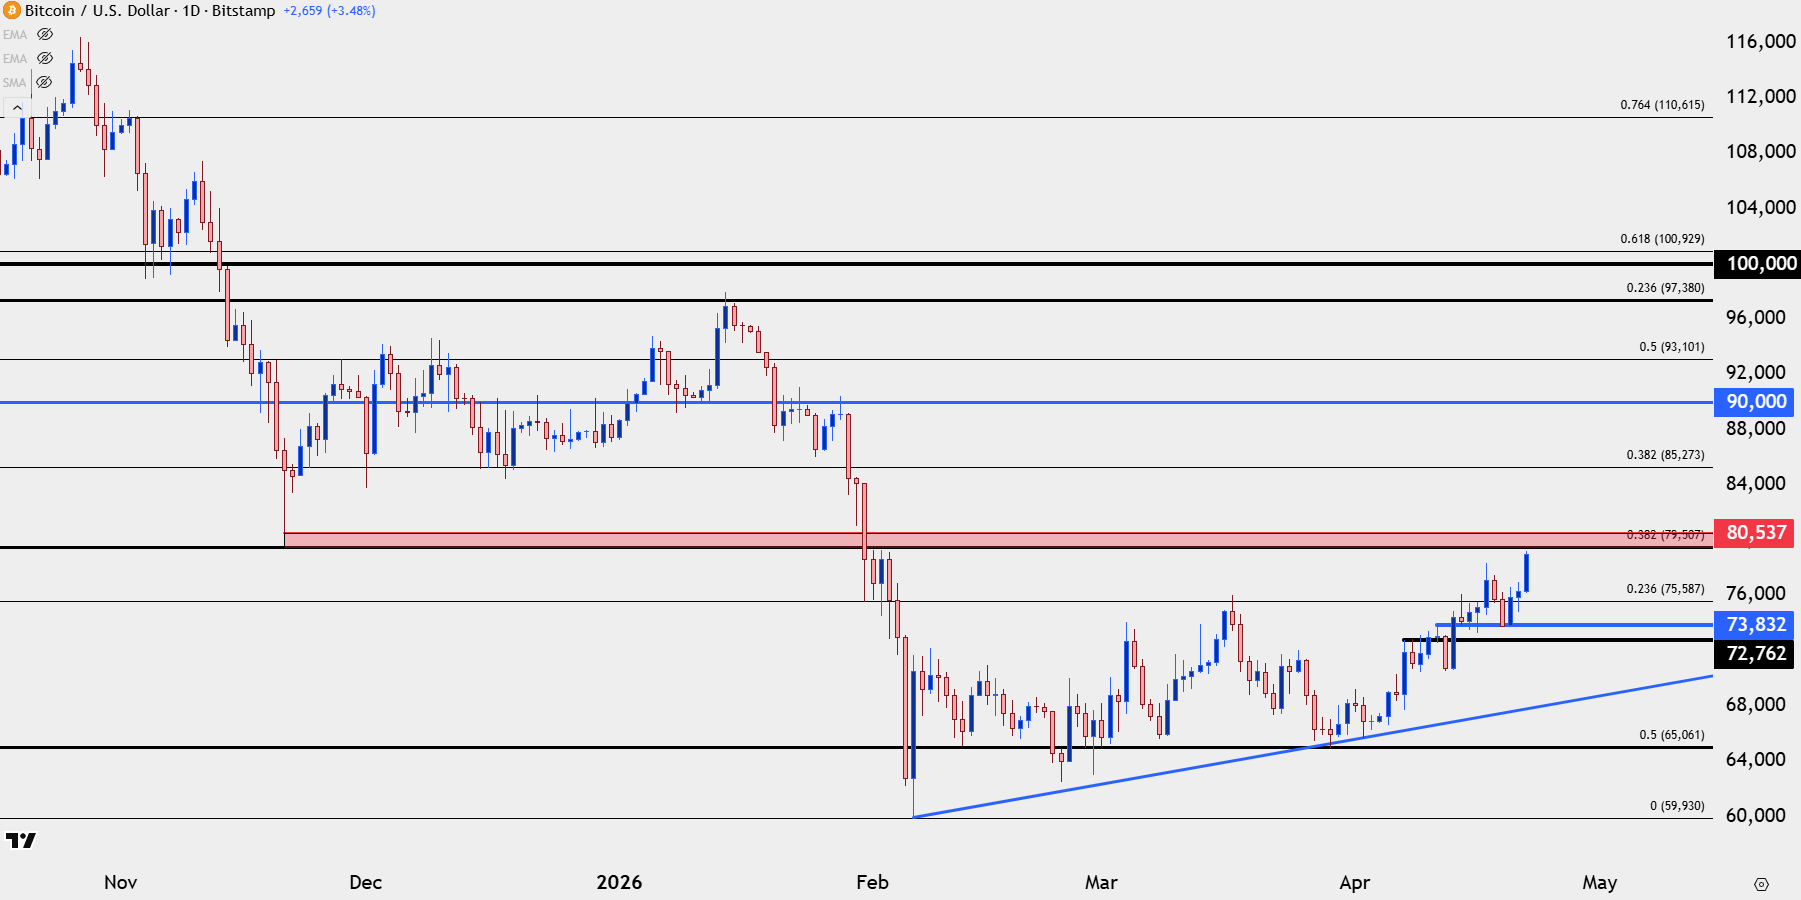
Chart prepared by James Stanley; data derived from Tradingview
Bitcoin Shorter-Term
Given the higher-low that printed as support at prior resistance, there’s a line-in-the-sand for bulls to defend to keep the bullish trend open for continuation, and that plots at 73,832. That then provides a few different spots for higher-low support to show or develop for bullish trend continuation setups, either before or after a test of the resistance zone looked at above.
Nearby is the prior high around 78,384, with a spot of support-turned-resistance below that at 76,939. And then the 75,757 level which is confluent with the shorter-term retracement level at 75,587.
Bitcoin (BTC/USD) Four-Hour Chart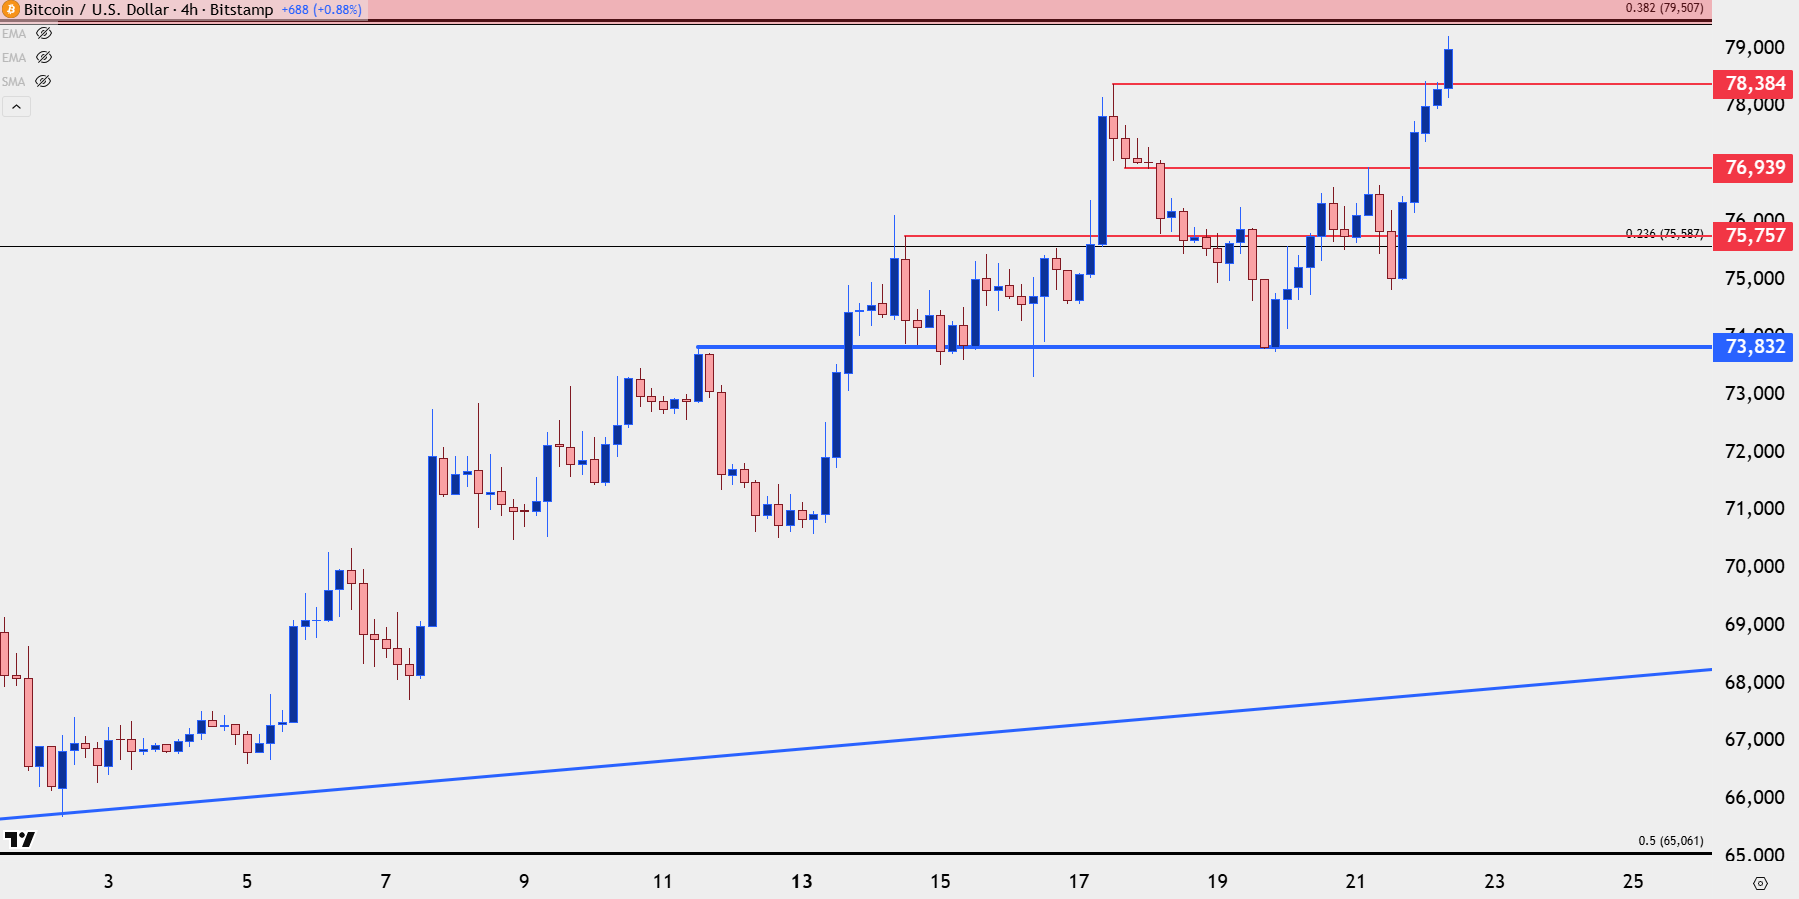
Chart prepared by James Stanley; data derived from Tradingview
--- written by James Stanley, Senior Market Analyst, Global Macro






