
The US dollar and yields continued to retrace from their cycle highs despite the hot US inflation report, thanks to dovish Fed comments which have cooled bets of an October rate hike. This still leaves December as the likely timing for the next move, but that pushback in expectations has been enough to help Wall Street stabilise and hint at a bounce.
Given that the correlation between the Nasdaq and crypto has increased significantly over the past week, it puts us on guard for a potential bitcoin (BTC) bounce heading into the weekend.
View related analysis:
- Australian Jobs Report Hammers Another Nail into the Coffin for RBA Hikes
- USD/CAD, GBP/CAD Price Action Hints at a Potential GBP/USD Bounce
- Gold Hints at Quiet Accumulation Despite Persistent US Dollar Strength
- USD/CAD Rally Looks Stretched, But CAD Bears Eye AUD and GBP
Bitcoin (BTC/USD) Eyes Rebound as Nasdaq and S&P 500 Stabilise
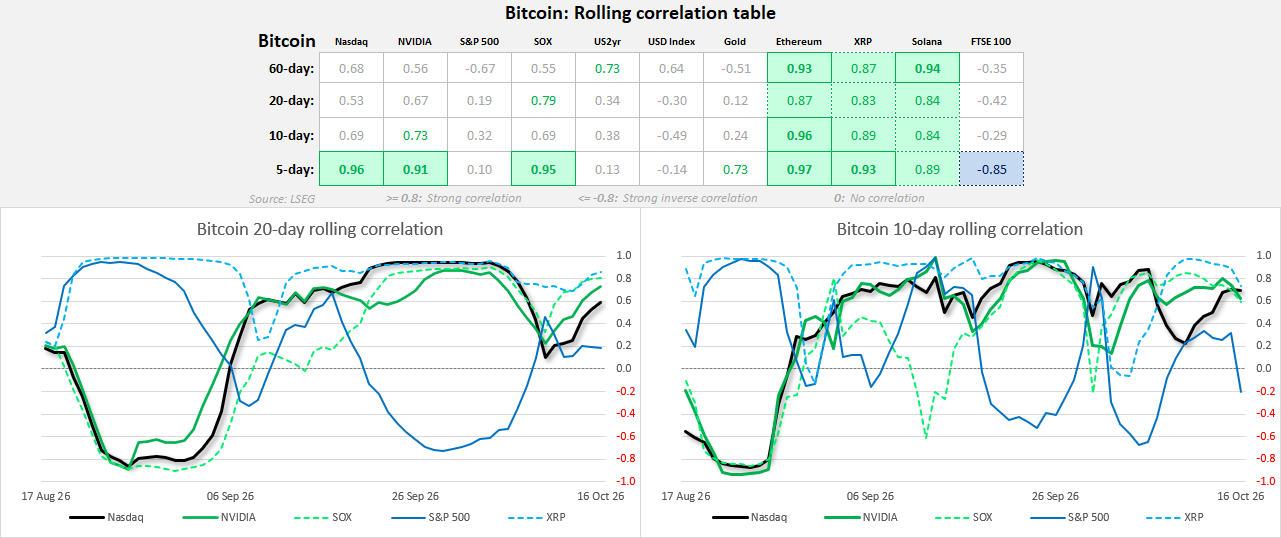
Bitcoin Correlations With Nasdaq and Tech Stocks Rebound
- While correlations between bitcoin and the technology sector have weakened in recent weeks, they appear to be making a comeback.
- The 5-day correlations between bitcoin and the Nasdaq, Nvidia and Philadelphia Semiconductor Index (SOX) have rebounded, with all now above 0.9.
- If sustained, this should see the 10- and 20-day correlations rise from current levels.
- Note that the strong correlations between BTC and Ethereum, XRP and Solana remain intact.

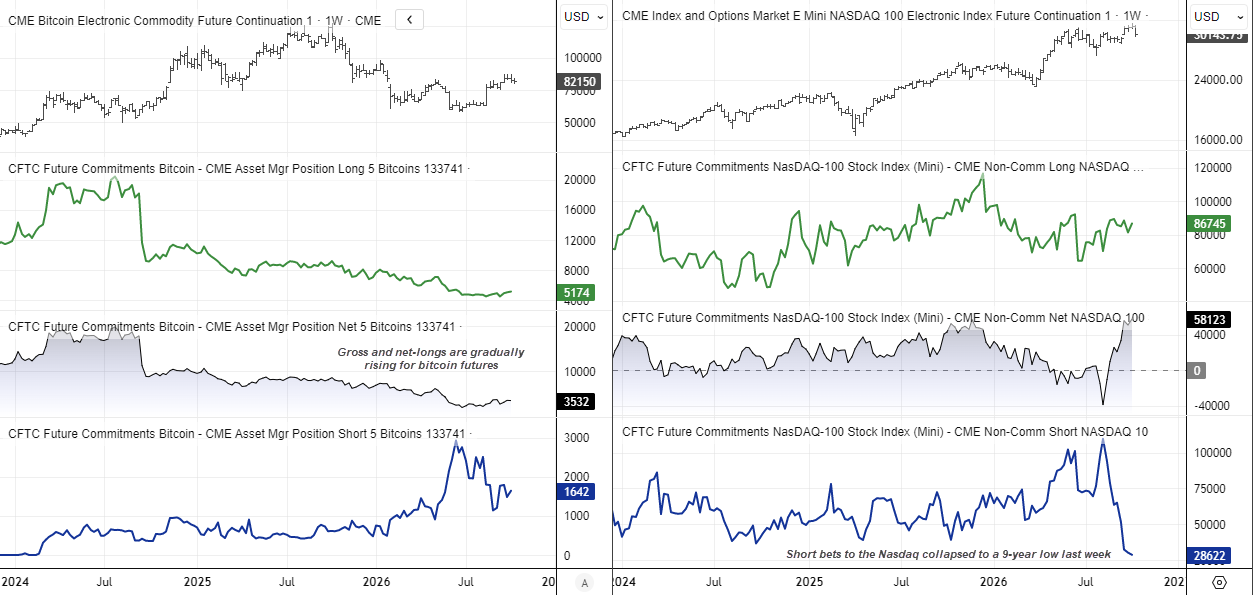
Nasdaq 100 Futures (MQ), Bitcoin Futures (BTC) Positioning | COT Report
The weekly chart shows both the Nasdaq and bitcoin are in uptrends, though both have also retreated from their cycle highs. The Nasdaq has seen the more notable retracement so far, as it has been more sensitive to hawkish Fed bets and concerns over a frothy AI market. However, that does not mean we should expect a deep pullback, particularly when taking CME futures positioning into consideration from the weekly Commitments of Traders (COT) report.
Short bets from large speculators have collapsed, falling to a nine-year low of 28.6k contracts by last Tuesday. While they likely increased this week, I doubt they have fully recovered to their previous highs above 100k. Traders therefore likely remain net-long, and the daily chart also provides clues of a potential bounce over the near term.
Meanwhile, large speculators are also gradually increasing long bets on bitcoin futures, which is gently pushing net-long exposure higher, while short positions stood at roughly a third of long positions in the latest report.
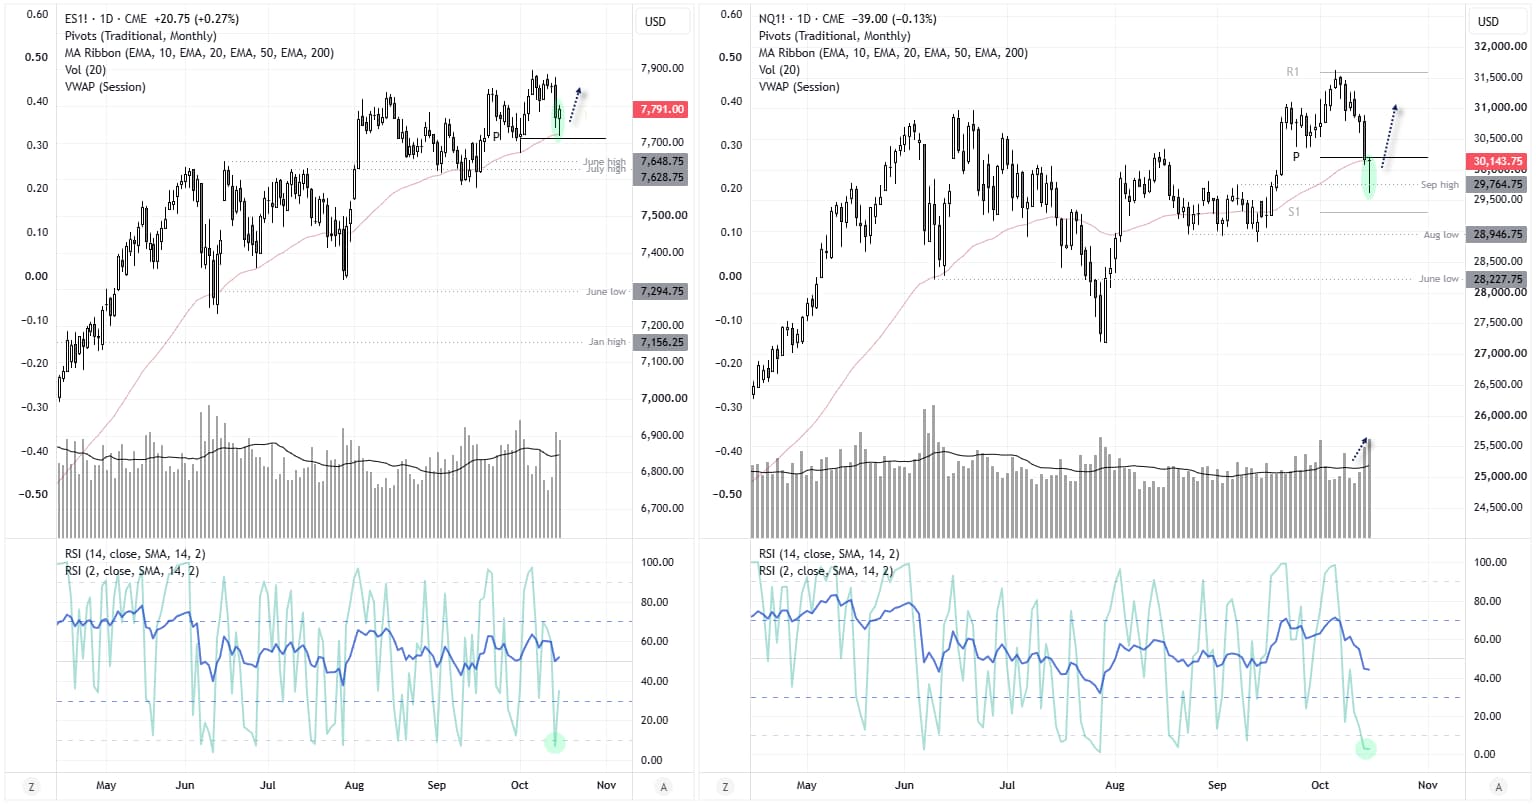
Wall Street Outlook: S&P 500, Nasdaq 100 Daily Charts
The dovish Fed comments helped the S&P and Nasdaq find stability on Thursday, bringing hope of a bounce into next week. A bullish hammer formed on the S&P daily chart, and its daily low respected the monthly pivot point and 50-dayu EMAS as support. Trading volumes on Thursday were also above average and nearly on par with the prior day’s selloff, which hints at a ‘change in hands’ from bears to bulls above support.
The Nasdaq actually broken beneath its monthly pivot point and 50-day EMA, though Thursday’s initial losses were fully recouped. Note the false intraday break of the September high, oversold daily RSI (2) and strongest daily volume since July 29 – which incidentally arrived the prior to the July swing low.
Source: CME, TradingView
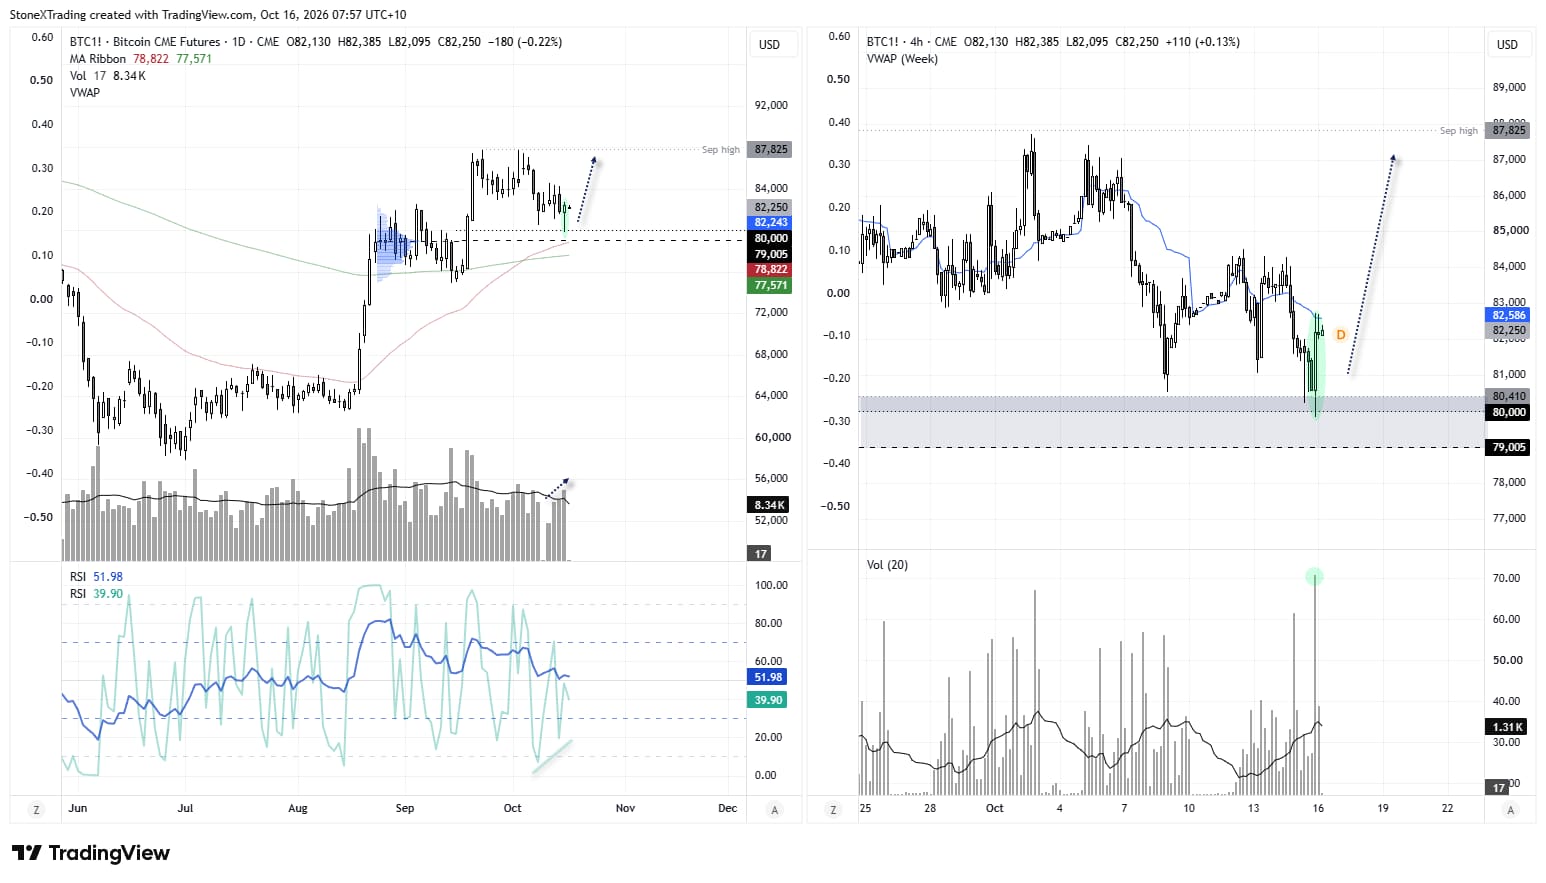
Bitcoin (BTC/USD) Technical Outlook: Bitcoin vs US Dollar
Given the revival of the Nasdaq-bitcoin correlation, and bitcoin's tendency not to miss out when sentiment is buoyant, a Nasdaq bounce could also lift BTC.
The daily chart shows a bullish hammer formed on above-average volume on Thursday, having found support almost perfectly at 80k. Note that the high-volume node at 79k sits near the 50-day EMA, with the 200-day EMA at 77,572 providing additional support, should it be required.
A bullish divergence formed on the daily RSI (2), while a prominent bullish engulfing candle – also on high volume – can be seen on the 4-hour chart.
Bulls could seek dips within Thursday's range in anticipation of a bounce towards the September highs, a break above which brings 90k into focus.
Source: CME, TradingView