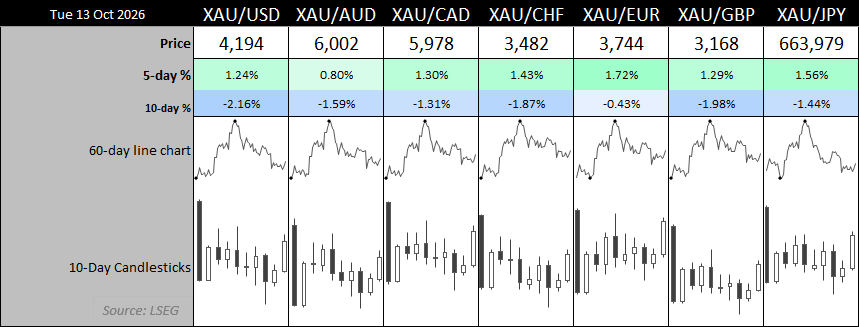
Gold prices are showing signs of stabilisation following a 14% decline from their August high, despite the US dollar index reaching an 18-month high. Falling trading volumes and waning bearish momentum suggest selling pressure is easing, while technical support above $4,000 could provide a foundation for a rebound towards $4,300. However, upcoming US inflation data, retail sales and remarks from Fed Chair Kevin Warsh could determine whether gold bulls regain control.
View related analysis:
- Gold Bears Approach Major Support, USD/CHF Eyes Reversal
- USD/CAD Rally Looks Stretched, But CAD Bears Eye AUD and GBP
- Swissy Attracts Safe-Haven Bets, AUD Shorts Surge to Record High | COT report
- AUD/USD Eyes Volatility Amid Middle East, Jobs, US CPI Crossfire
Gold Price Outlook: Quiet Accumulation Emerges as US Dollar Rally Stretches
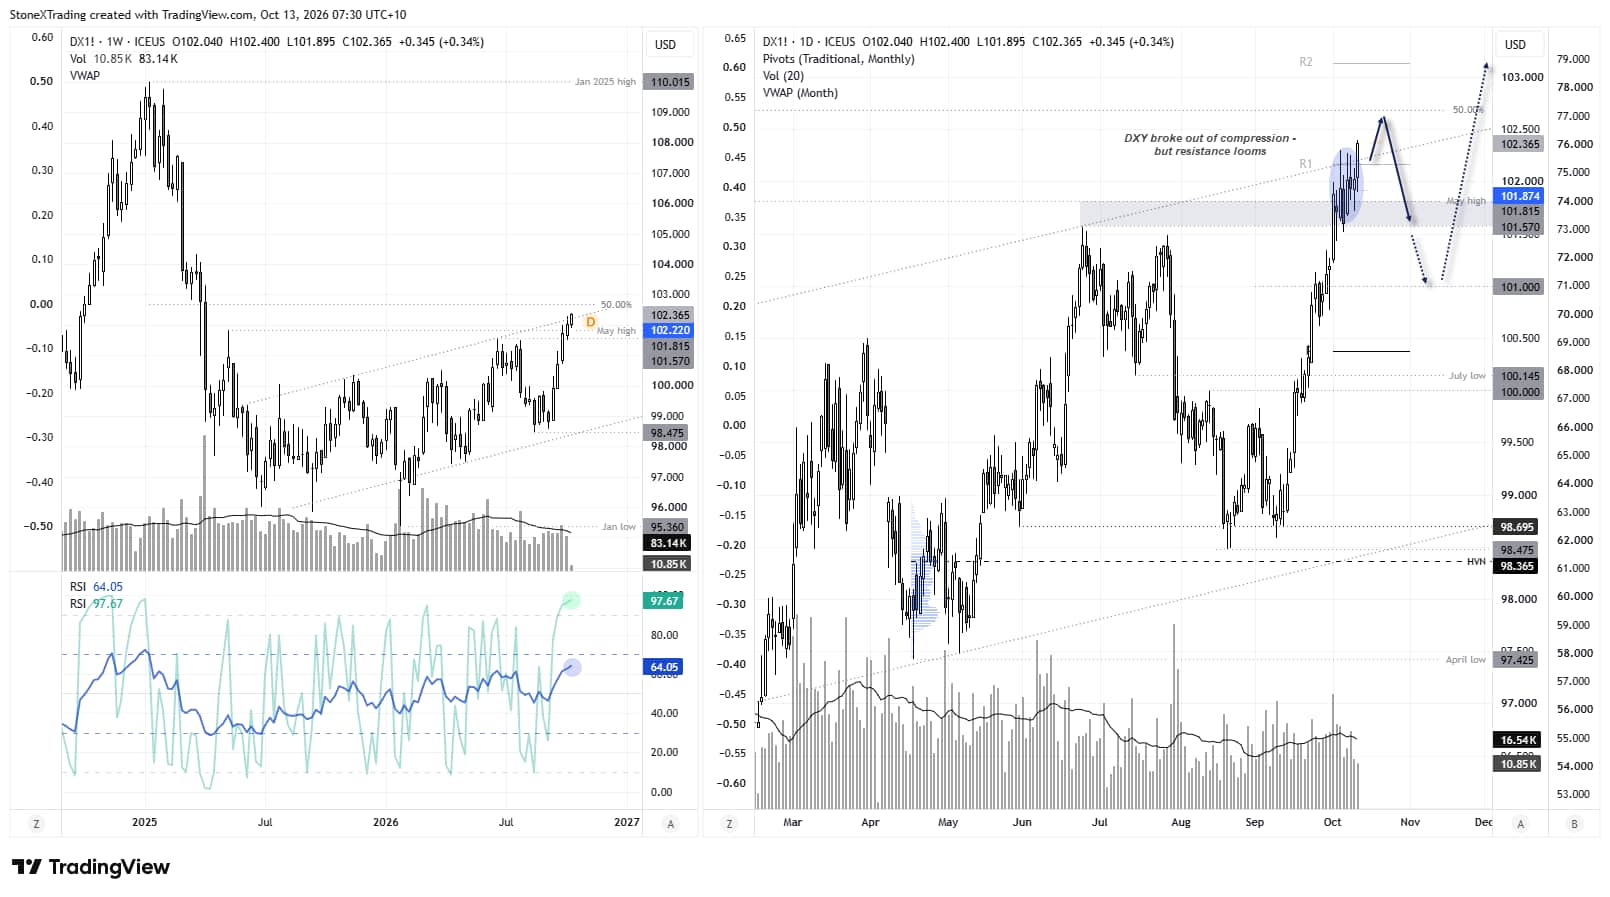
US Dollar Index (DXY) Technical Outlook
We saw the dollar extend its rally on Monday, as it tries to notch up its fifth consecutive weekly gain. It seems traders are bidding up the US dollar heading into this week’s inflation and retail sales reports, with Fed Chair Kevin Warsh also set to deliver remarks.
But with resistance looming and expectations of hot data and hawkish comments, I am now wondering whether the USD has rallied too far over the near term. Anything less than a hot CPI print could provide the Fed with more time – and we’re already seeing traders push back expectations for the first hike as it is.
So while headlines will focus on DXY reaching an 18-month high, I am noting resistance overhead and the potential for data not to be as hot, or comments as hawkish, as bulls would like. And that could potentially set the stage for a rebound in gold prices.
Gold Futures (GC) Technical Outlook
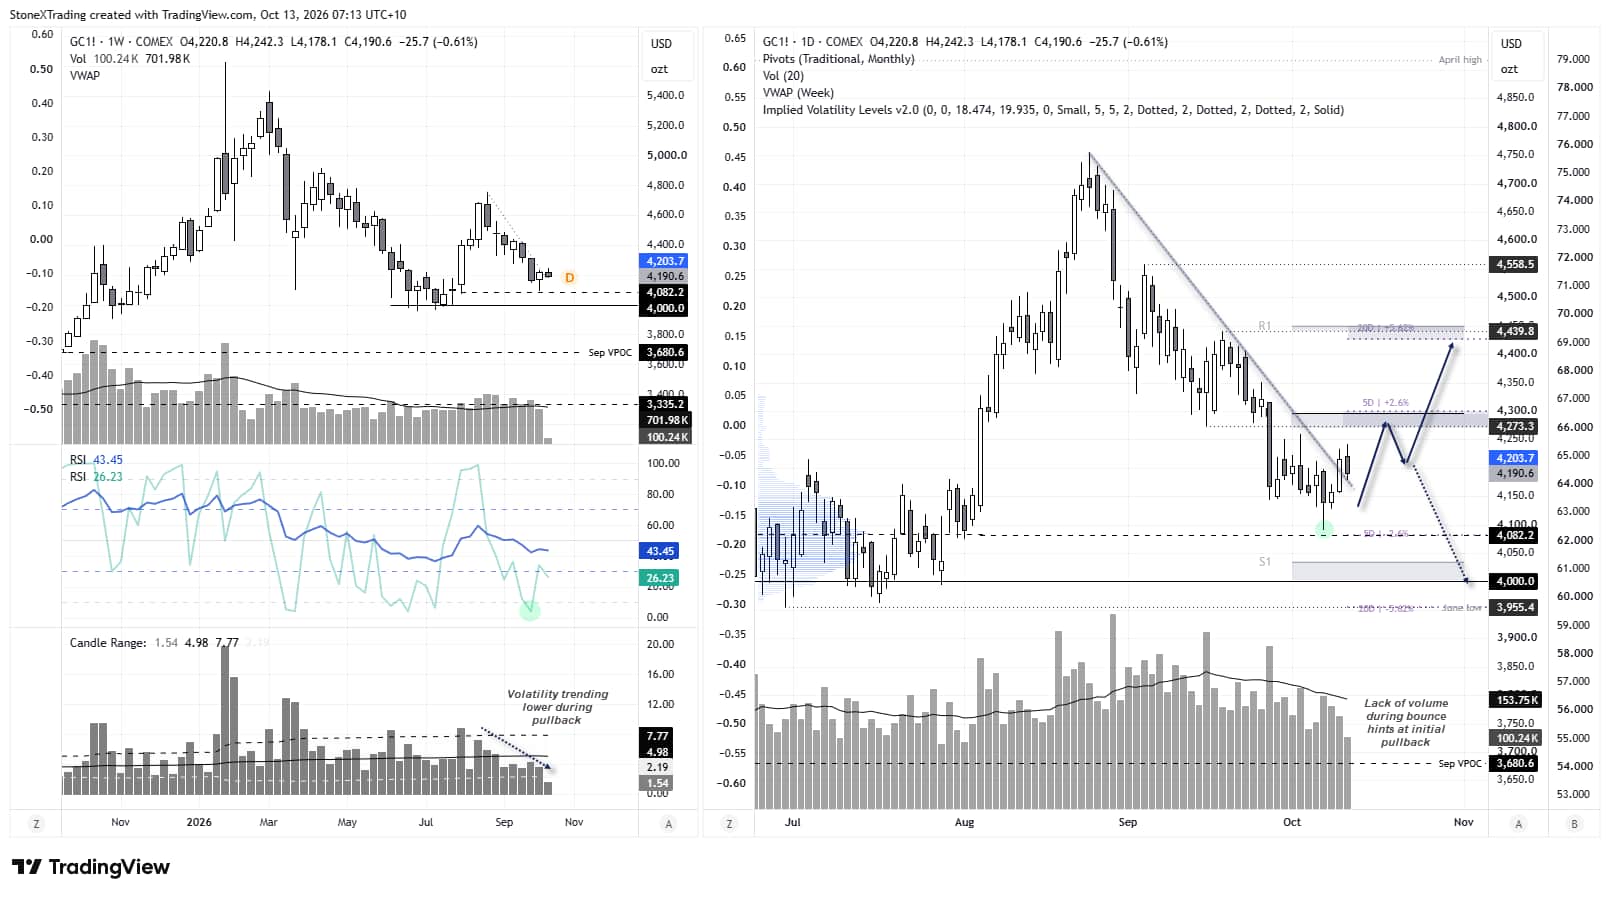
Following a 14% retracement from its August high, gold is showing signs of waning bearish momentum above $4,000. This suggests to me that dip buyers are not waiting for prices to test the big round number.
A small bullish pin bar formed last week to show a mild attempt to reverse the trend, while the lower indicator shows that weekly high-to-low volatility has generally been trending lower during gold's recent decline.
Also note that weekly trading volumes have been falling, which is not what I’d expect to see during a convincing bearish move. The weekly RSI (2) also reached oversold territory two weeks ago and is now attempting to turn higher alongside gold prices.

Gold Price Outlook: Bulls Eye Dips Above 4,091
The daily chart shows a mild attempt to break trend resistance on Friday. The fact that trading volumes were low makes Monday’s pullback less of a surprise, especially with US CPI, retail sales and a speech from Kevin Warsh pending. If anything, it gives me hope that gold will continue to retrace gently within last week’s range.
Also note that last week’s low held above the 4,082.2 high-volume node (HVN), which incidentally sits near the lower one-week implied volatility band. My initial upside target is the monthly pivot point, just below the 4,300 handle and upper one-week implied volatility band.
Ultimately, I suspect quiet accumulation is taking place in gold, which could make such dips appealing to bulls while prices hold above the 4,091.2 low.
Source: COMEX, TradingView
Gold futures (GC) weekly and daily technical charts showing fading bearish momentum, support above $4,091 and potential upside towards $4,300.
Gold Tries to Form Intraday Base
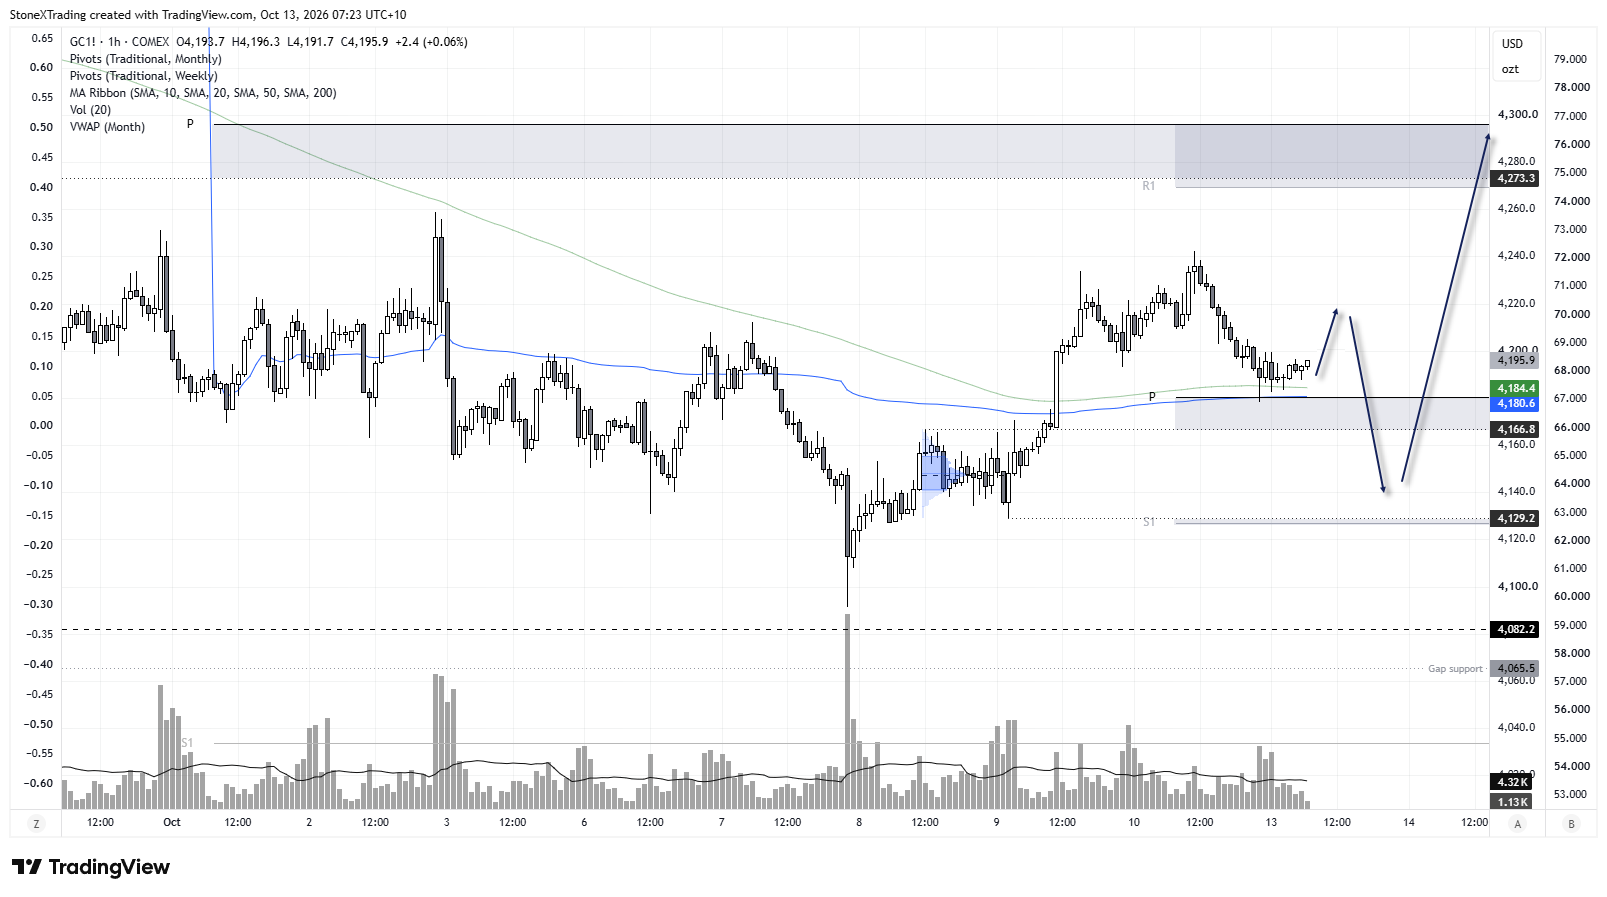
The 1-hour chart shows that Monday’s pullback is trying to form a base around 4,180 – where several technical levels converge. Monday’s low respected the weekly pivot point and month-to-date VWAP, while prices are now holding above the 200-bar SMA. This could pave the way for an intraday bounce today, though risks of a deeper pullback remain.
If prices do break lower, bulls could seek evidence of a swing low around the 4,166.8 high, or the 4,130 area near the weekly S1 pivot and swing low.
Source: ICE, TradingView