
Bitcoin Summary
Risk on is back in a very big way today with US equities putting in a gap-and-go from the open. It’s not just stocks that are rallying, however, as Bitcoin has been pushing higher and this makes the Friday test of 100k look like confirmed support. Perhaps more attractive for bulls is the fact that that Friday test of 100k couldn’t quite get down for a fresh low – buyers came in ahead of a re-test and that illustrates some element of bullish anticipation.

But, as I looked at in the article on the matter on Wednesday, the big question now is whether sellers will use this bounce to reduce exposure, driven by the fear that a deeper retracement may soon show.
From the four-hour chart, however, the shorter-term trend looks clean. There’s an attempted hold of support at 105k and while that’s still early, the fact that a quick dip below that price evoked buyers is another positive for bulls. A bit lower, there’s a deeper possible support level around 103,530 which is a spot of support-turned-resistance. And below that, it’s the swing at 101,435 that stands out because if bulls can’t hold price above that, it’ll look like another 100k test is soon on the way; and the failure to hold the short-term trend denotes bearish potential from the bigger picture that I’ll look at in a moment.
Bitcoin (BTC/USD) Four-Hour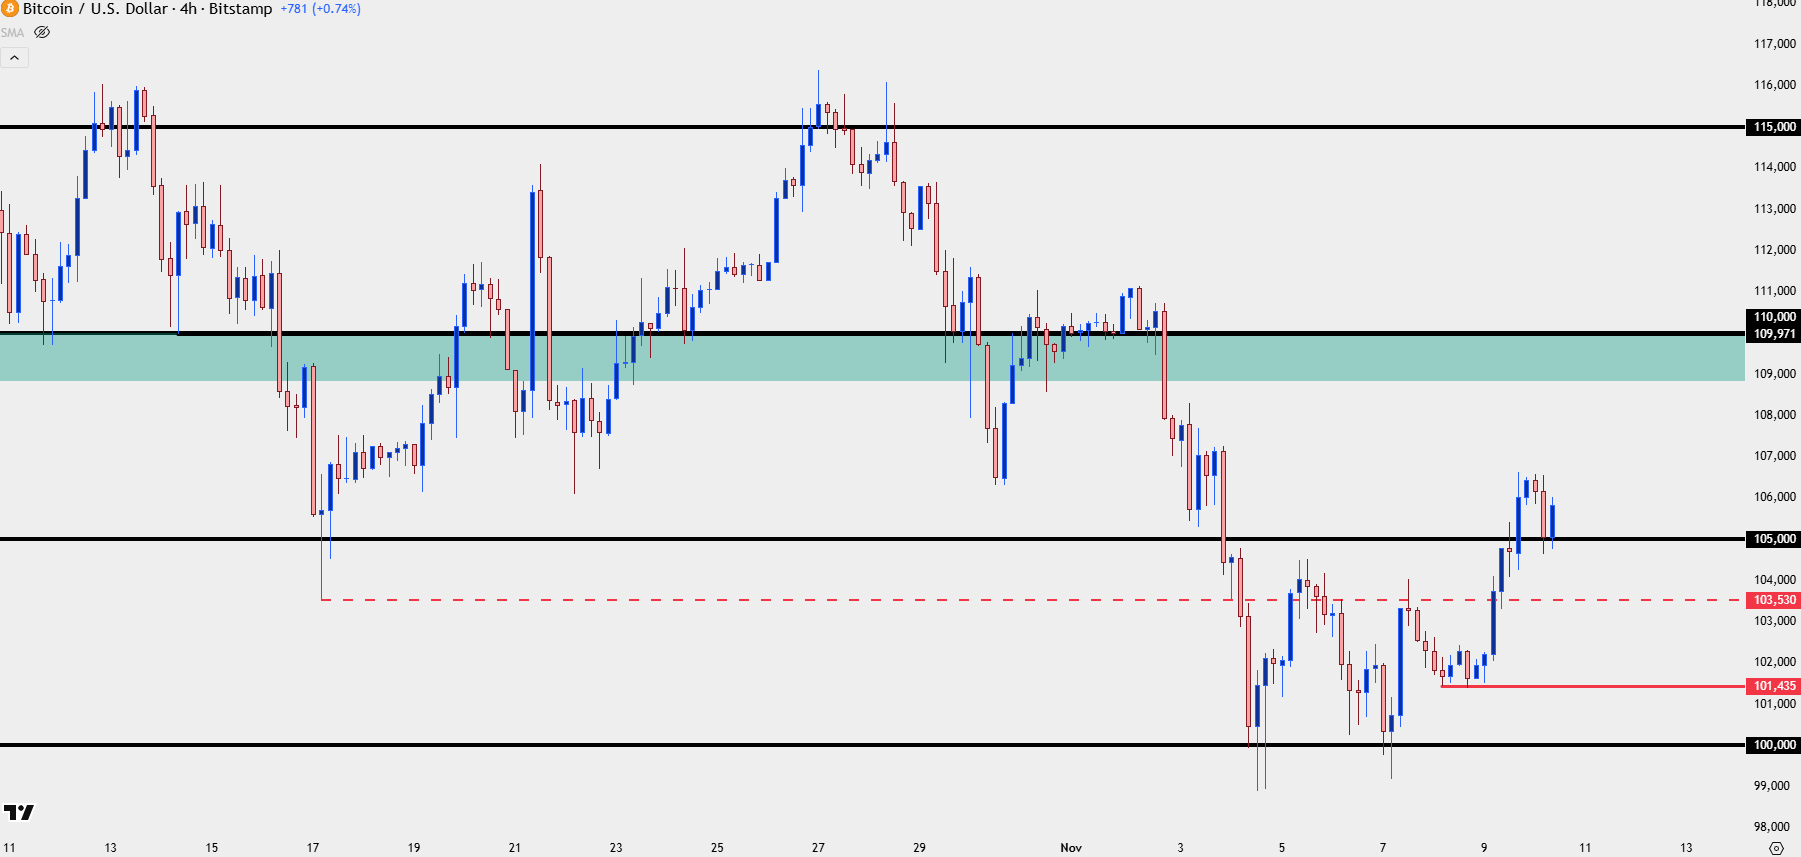
Chart prepared by James Stanley; data derived from Tradingview
Bitcoin Daily
The daily chart is where matters still feel less stable as price is fast nearing a series of prior support swings, and until bulls can chew through that there’s going to be the fear of resistance playing from prior support. If buyers can push up to the 110k zone, however, that view can begin to shift, which would then put 115k and possibly even 120k back on the horizon. But, for now, light risk should be a priority as the move from 100k is already well-developed.
Bitcoin (BTC/USD) Daily Chart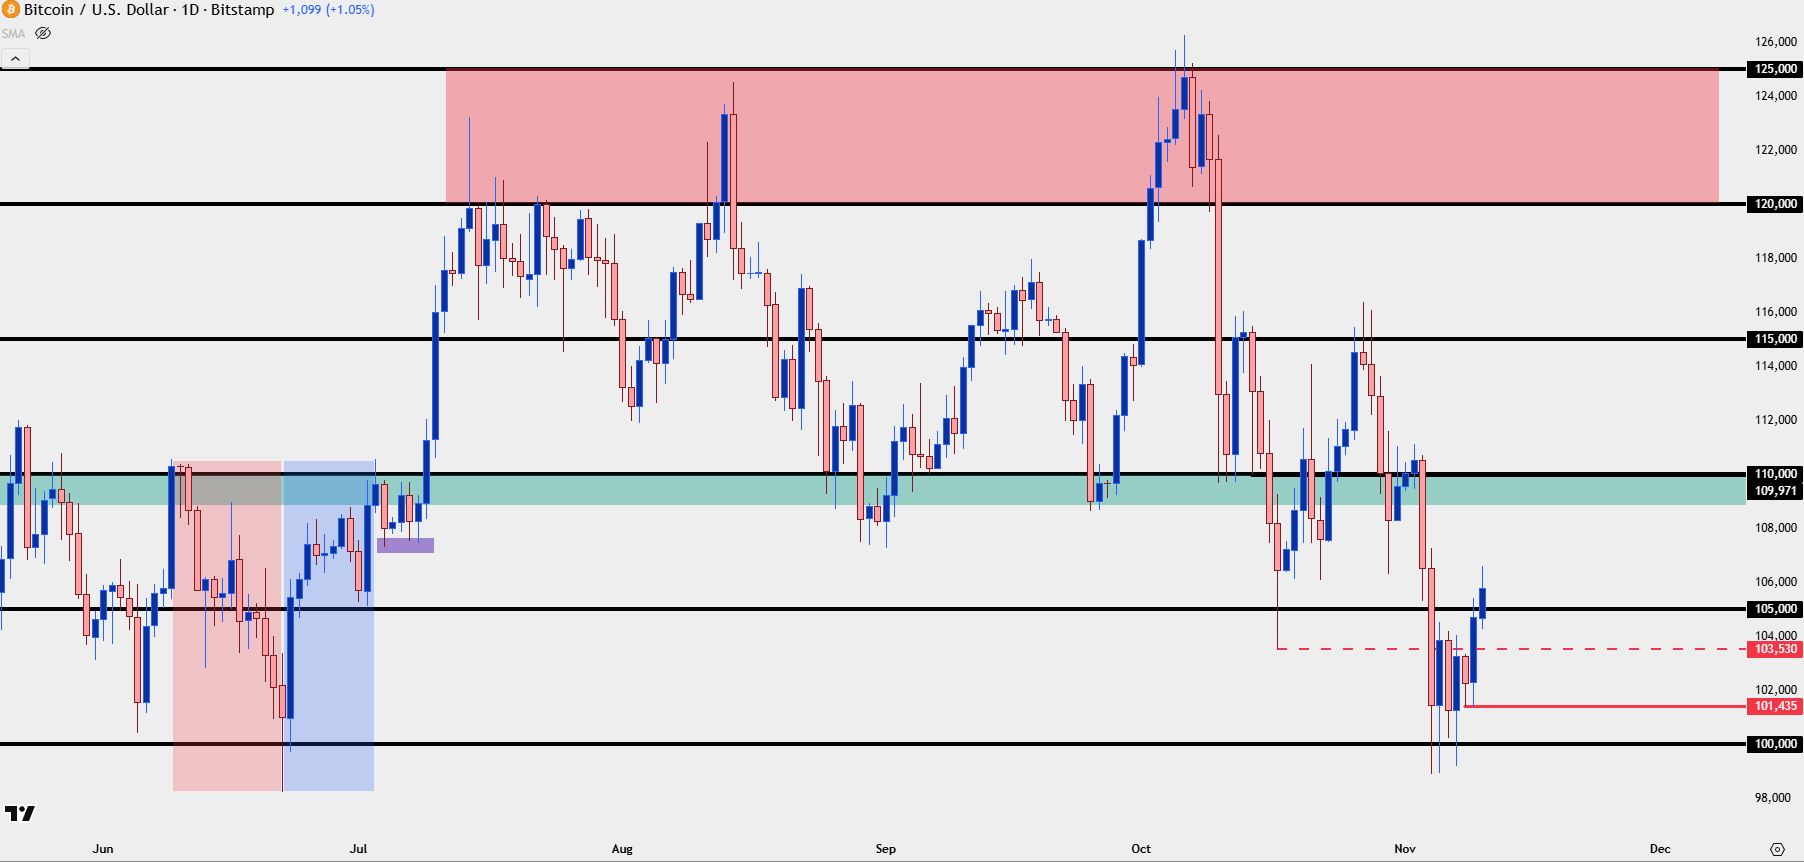
Chart prepared by James Stanley; data derived from Tradingview
--- written by James Stanley, Senior Market Analyst, Global Macro