


There’s a distinctly uneasy tone running through global markets at present, and much of it stems from developments in the energy complex. Oil continues to march higher, with Brent prices pushing beyond the psychologically important $100-per-barrel mark. Ongoing tensions surrounding the Strait of Hormuz — and the lack of progress in talks between the United States and Iran — have only added fuel to the fire. Bitcoin has been stuck between a rock and a hard place, but it must now decide which way it wants to go.
How can oil volatility impact Bitcoin forecast?
The oil market volatility matters for Bitcoin, although probably not as much as European stocks. Still, elevated oil prices will weigh on importing regions’ economy, which in turn could reduce investments in all sorts of assets including stocks and crypto.
This is a particularly important consideration for Europe, where major economies remain heavily dependent on imported energy. We’re already seeing signs of strain: the German DAX, for instance, has struggled to keep pace with Wall Street’s push to fresh highs. Should selling pressure intensify across European equities, it’s not unreasonable to expect some spillover into crypto markets as well.
BTC/USD technical analysis
Against this backdrop, Bitcoin’s recent price action has, on the face of it, been constructive. The market has broken out of a period of consolidation and pushed above a descending trendline, forming a sequence of higher highs and higher lows — a textbook bullish structure.
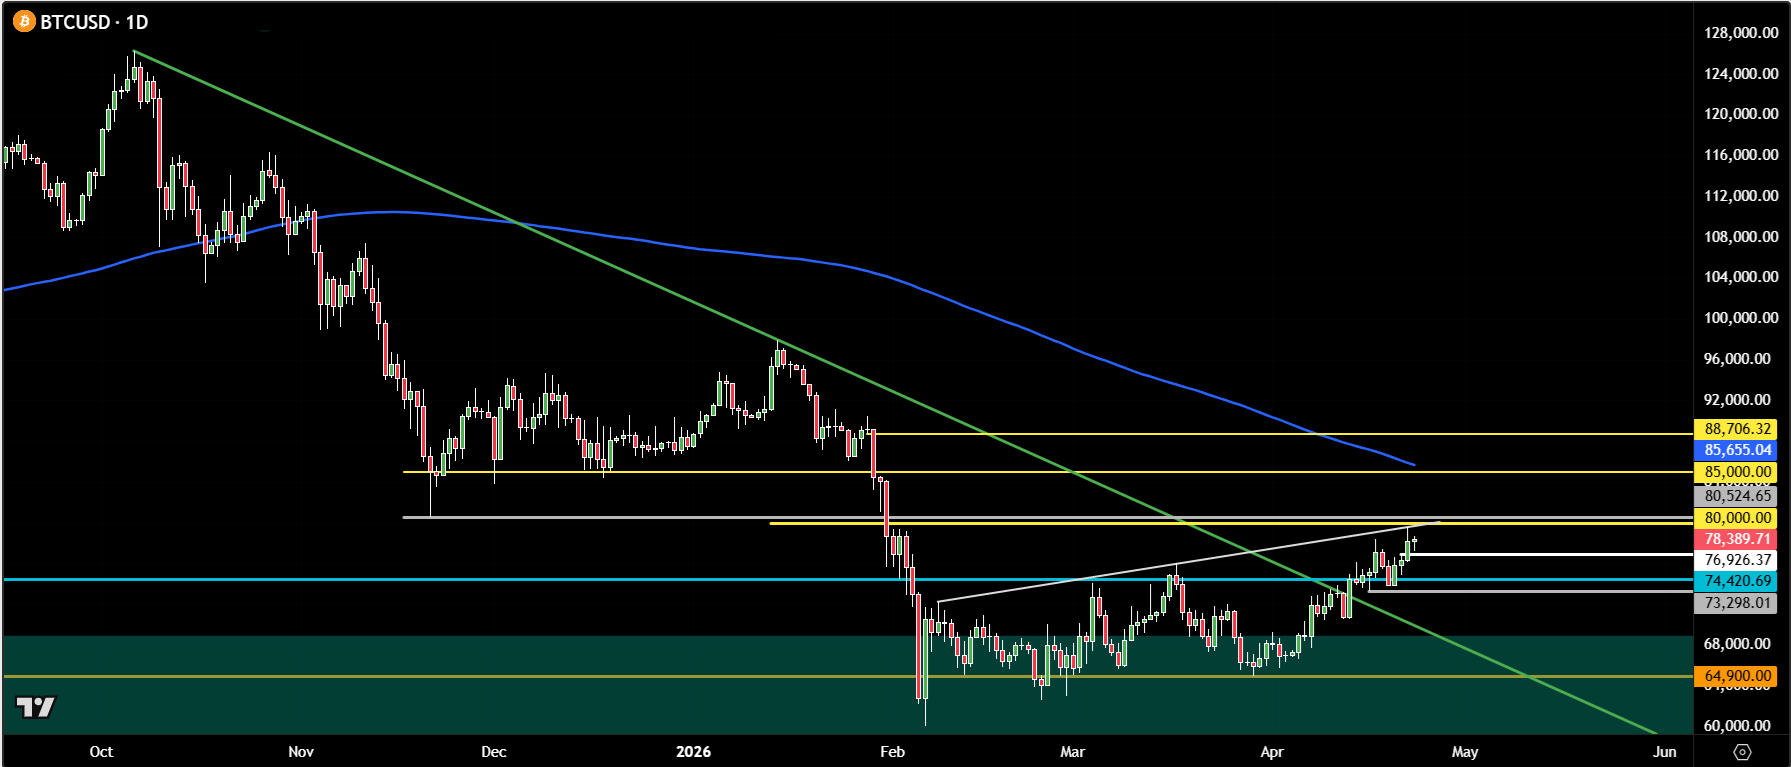
However, today’s slight pullback in BTCUSD has introduced a note of caution. Price has encountered resistance along a short-term trendline connecting recent peaks. For now, this appears largely technical, but the broader context — particularly weakness in European equities — suggests this could also reflect a more cautious, risk-off sentiment creeping into the market.
Bitcoin forecast: Key levels to watch
Key levels are now coming into sharper focus. The $76,900 - $77,000 region, cleared during yesterday’s rally, is the first area to watch on the downside. Beneath that sits $74,000- 75,000, an area that has previously acted as both support and resistance. This zone remains a critical region that could determine the near-term direction.
On the topside, $80,000 stands out as the next major psychological hurdle. Slightly above it, $80,500 is also an important level as it was previously a key support level. A clean break above this $80,000 - $80.500 area would help confirm whether the current breakout has genuine staying power.
That said, the technical picture isn’t entirely straightforward. There remains the possibility that recent price action could evolve into a bearish flag pattern — something we’ve seen before. If that scenario plays out, it would suggest the current move higher is merely a pause before another leg lower, rather than the start of a sustained rally.
For the bearish scenario to play out, the bears would like to see a break below roughly $73,300 — the most recent swing low — as this would raise more serious concerns. That level marks the point before Bitcoin printed a new higher high, and losing it would undermine the current bullish structure.
Given the broader macro environment — rising energy prices, fragile sentiment in European markets, and the ever-present risk of unexpected headlines — a degree of caution remains warranted.
For now, the most sensible approach is to take things one level at a time. Bitcoin may well be on the cusp of a more sustained move higher, but until key resistance levels are convincingly cleared, the question remains: can this breakout truly hold?

-- Written by Fawad Razaqzada, Market Analyst
Follow Fawad on Twitter @Trader_F_R






