
Canadian Dollar Outlook: USD/CAD
USD/CAD may attempt to retrace the decline from the monthly high (1.3879) as it bounces back ahead of the 50-Day SMA (1.3693), and the flattening slope in the moving average may indicate a potential change in trend as the exchange rate no longer trades within the June range.
Canadian Dollar Forecast: USD/CAD Bounces Back Ahead of 50 Day SMA
USD/CAD extends the advance following the 40.8K drop in Canada Employment to stage a three-day rally, and signs of a slowing economy may keep the exchange rate afloat as it puts pressure on the Bank of Canada (BoC) to lower interest rates.
In turn, the Canadian Dollar may face headwinds ahead of the next BoC meeting on September 17 as the central bank assumes that ‘in the current tariff scenario, total inflation stays close to 2% over the scenario horizon as the upward and downward pressures on inflation roughly offset,’ and data prints coming out of the US may also sway USD/CAD as the Federal Reserve continues to combat inflation.
US Economic Calendar
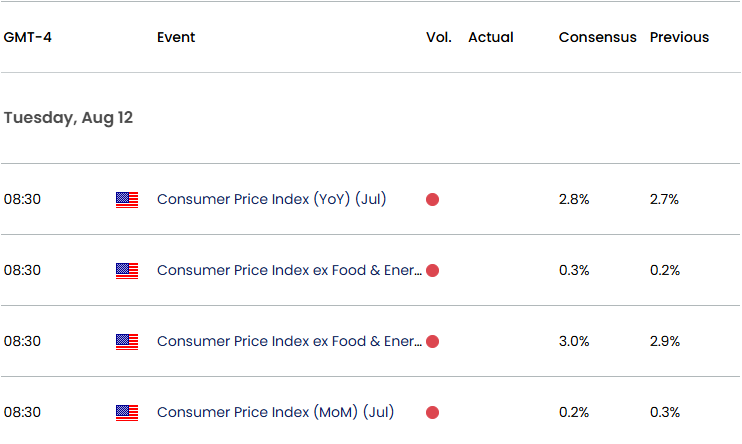
The US Consumer Price Index (CPI) is anticipated to show a rise in both the headline and core rate of inflation, and signs of persistent price growth may force the Federal Open Market Committee (FOMC) to keep US interest rates higher for longer as the central bank is ‘well positioned to learn more about the likely course of the economy and the evolving balance of risks before adjusting our policy stance.’
Join David Song for the Weekly Fundamental Market Outlook webinar. David provides a market overview and takes questions in real-time. Register Here
As a result, USD/CAD may further retrace the decline from the monthly high (1.3879), but a softer-than-expected CPI report may curb the recent rally in the exchange rate as it fuels speculation for an imminent Fed rate-cut.
With that said, USD/CAD may struggle to retain the advance from the monthly low (1.3722) on the back of expectations for lower US interest rates, but the exchange rate may establish a series of higher highs and lows as it bounces back ahead of the 50-Day SMA (1.3693).
USD/CAD Price Chart – Daily
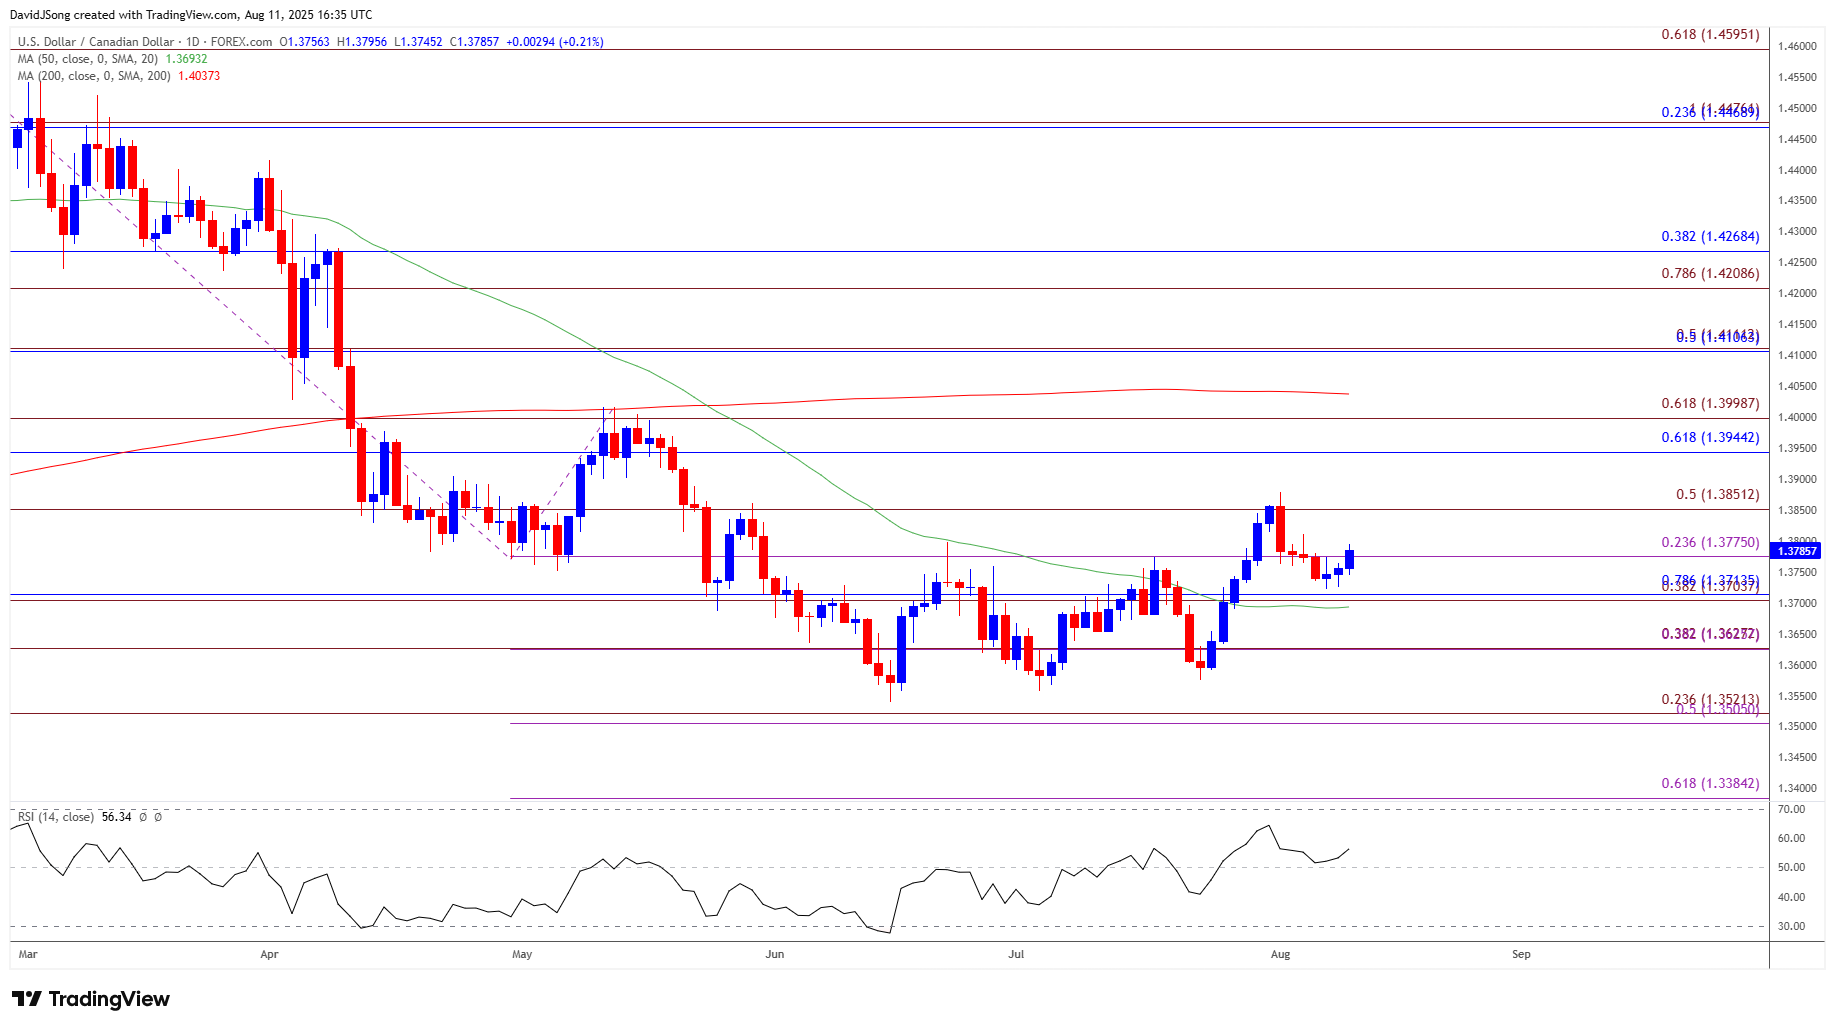
Chart Prepared by David Song, Senior Strategist; USD/CAD Price on TradingView
- USD/CAD holds above the 50-Day SMA (1.3693) as it stages a three-day rally, and a close above 1.3780 (23.6% Fibonacci extension) may push the exchange rate toward 1.3850 (50% Fibonacci extension).
- A breach of the monthly high (1.3879) brings the 1.3940 (61.8% Fibonacci retracement) to 1.4000 (61.8% Fibonacci extension) zone on the radar, with the next area of interest coming in around the May high (1.4017).
- However, lack of momentum to hold above the 1.3700 (38.2% Fibonacci extension) to 1.3710 (78.6% Fibonacci retracement) region may push USD/CAD toward 1.3630 (38.2% Fibonacci extension), with the next area of interest coming in around the July low (1.3557).
Additional Market Outlooks
US Dollar Forecast: EUR/USD Climbs to Fresh Weekly High
British Pound Forecast: GBP/USD Rebound Persists Ahead of BoE
USD/CHF Struggles as More Fed Officials Prepare to Adjust Policy
USD/JPY Reflects Bearish Price Series amid Failed Test of March High
--- Written by David Song, Senior Strategist
Follow on Twitter at @DavidJSong