
Key Events
- The U.S. government shutdown continues to weigh on market sentiment, with U.S. indices and crude oil both reaching critical support levels.
- U.S. CPI data is scheduled for release this week but remains overshadowed by the government shutdown.
- Chinese CPI rises back near yearly highs, reaching +0.2%.
Technical Analysis: Quantifying Uncertainties
WTI Outlook: Weekly Time Frame – Log Scale
Source: Tradingview
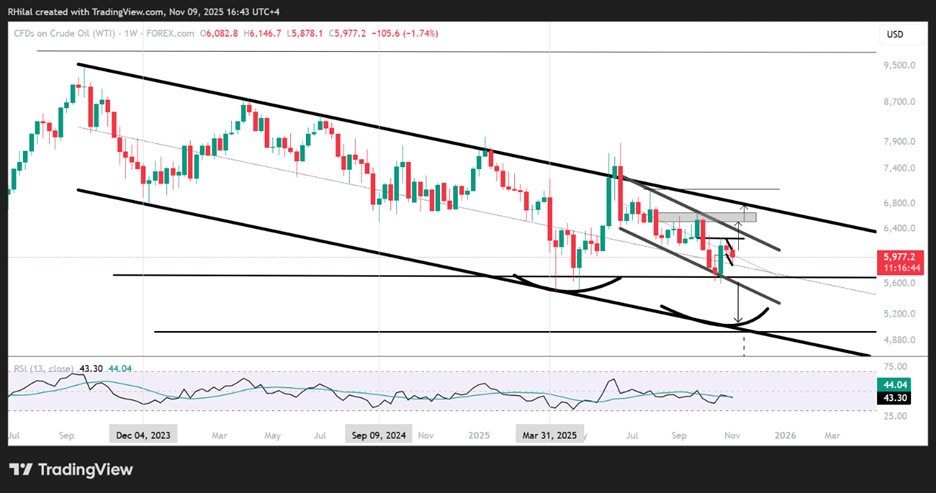
U.S. oil prices continue to respect the boundaries of a downward channel connecting consecutive lower highs and lower lows since 2022.
The latest price action is holding near the mid-zone of the channel, slightly above the $59 mark, pressured by risk-off sentiment driven by the prolonged U.S. government shutdown that began in early October 2025, the wave of AI-related layoffs, and overall stretched market sentiment as 2025 comes to a close.
A turnaround in sentiment could redirect oil prices toward the $70 mark, while further deterioration may pressure prices toward another critical support near $49.
Key levels across U.S. indices may confirm whether a broader market downturn or a potential turnaround is developing:
Dow Jones, Nasdaq, and S&P 500 – 3-Day Time Frame Outlook 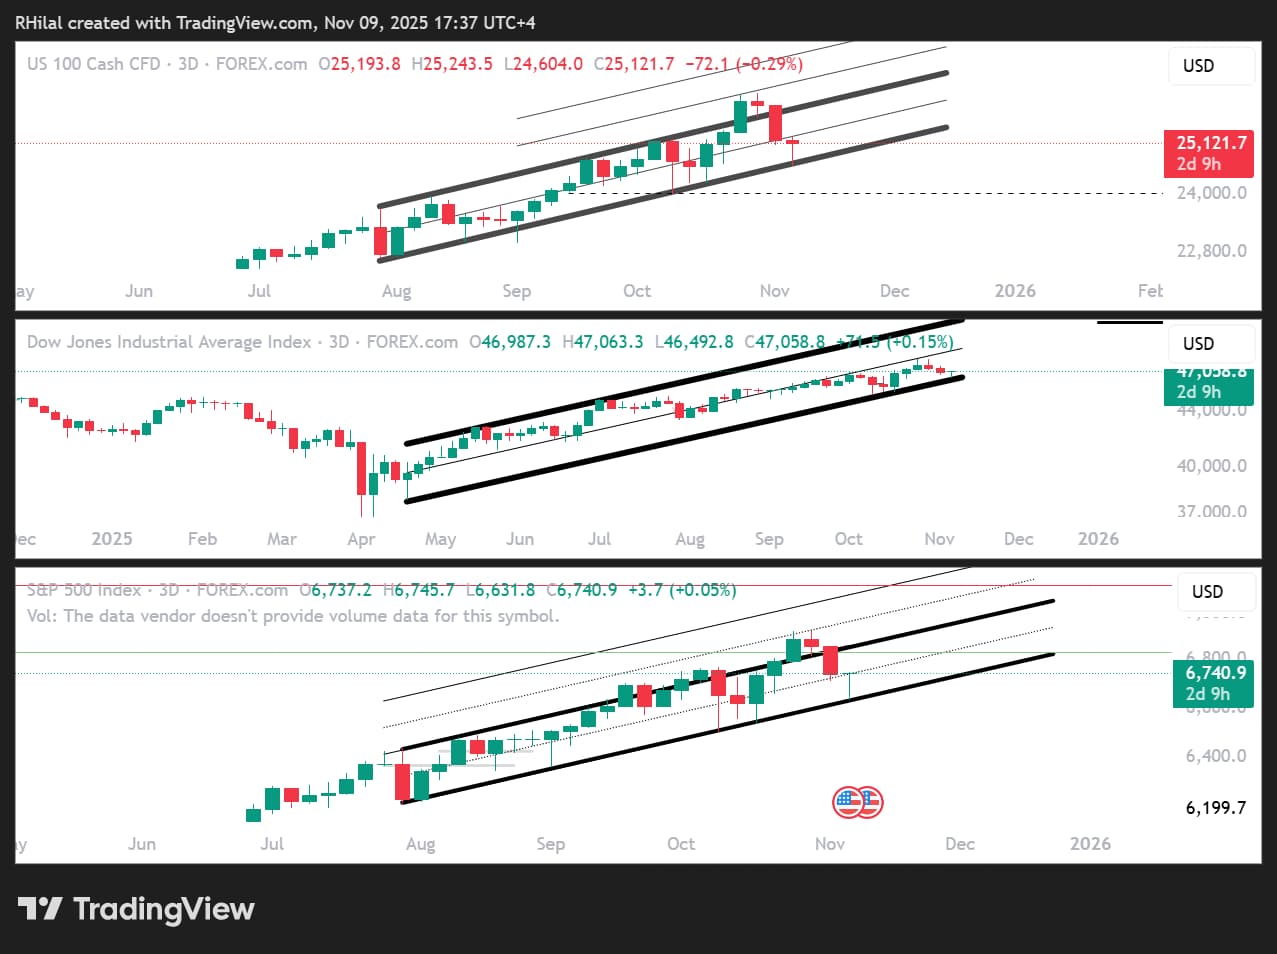
The S&P 500 and Nasdaq remain within their ascending channels extending from August, while the Dow Jones continues to trade within a channel originating from April.
This alignment supports the case for a continuation in overall market risk sentiment toward year-end or, alternatively, a deeper retracement if prices close below their respective trendline boundaries.
By Friday evening, all three indices had rebounded from the lower boundaries of their channels toward the mid-zones, awaiting confirmation of a directional breakout.
- Dow Jones:
- Downside risk below 46,400
- Upside potential above 47,200
- Nasdaq:
- Downside risk below 24,600
- Upside potential above 25,800
- S&P 500:
- Downside risk below 6,630
- Upside potential above 6,770
These levels are expected to define market sentiment shifts, which in turn will help refine the outlook for crude oil prices.
WTI Outlook: Weekly Time Frame – Log Scale
Source: Tradingview
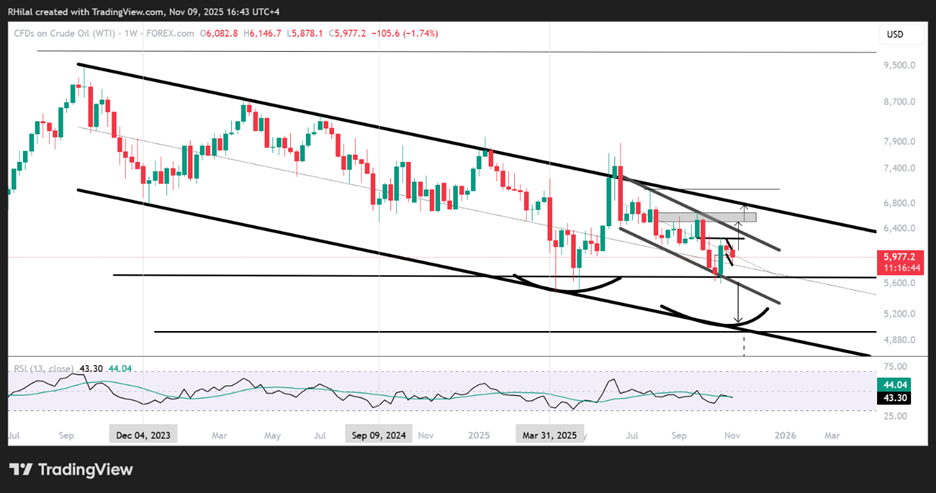
Crude prices are hovering near the 3 year down trending channel midzone , and the 5 month down Crude oil prices are currently hovering near both the mid-zone of the three-year downtrend channel and the mid-zone of the five-month channel, establishing key short-term and long-term reference points as the market navigates 2026 supply uncertainties and labor market risks.
A breakout above the short-term channel resistance, first at $63 and then $66.80, would extend potential gains toward the upper boundary of the long-term channel near $70, signaling the possibility of a sustained structural recovery in crude for the years ahead.
Conversely, a confirmed break below the lower boundary of the short-term channel and the yearly low at $55 could open the way toward the lower boundary near $49, where another technical rebound could develop.
Written by Razan Hilal, CMT
Follow on X: @Rh_waves