


Key Events
- China’s GDP report (Monday) is expected to decline from 5.2% to 4.7%, weighing on crude demand expectations.
- Additional Chinese data due Monday — including loan prime rates and industrial production — will further shape the outlook.
- Flash manufacturing and services PMI data from the UK, EU, and US (Thursday) will offer deeper insight into global economic activity and sentiment.
- Markets expect new 2025 lows for Crude oil prices
China and EU pressures
Weak growth projections and the ongoing energy transition across China and the EU are dampening the broader outlook for crude, compounded by US–China tariff tensions. This combination continues to weigh on sentiment, keeping prices under pressure and positioning the market toward the $50–$49 zone.
China’s quarterly GDP report is expected to slip from 5.2% to 4.7% on Monday, alongside a dip in industrial production from 5.2% to 5.0%. These figures keep crude anchored near 2025 lows as seasonal demand transitions between the summer and winter periods.
The EU is also contributing to the weaker growth and demand outlook amid ongoing Russia–Ukraine tensions. Flash manufacturing and services PMIs on Thursday are expected to shed light on economic activity and potential volatility in euro pairs. Recent readings show mixed sentiment, with manufacturing slightly below 50 (indicating contraction) and services modestly above 51, signaling mild expansion.
Technical Analysis
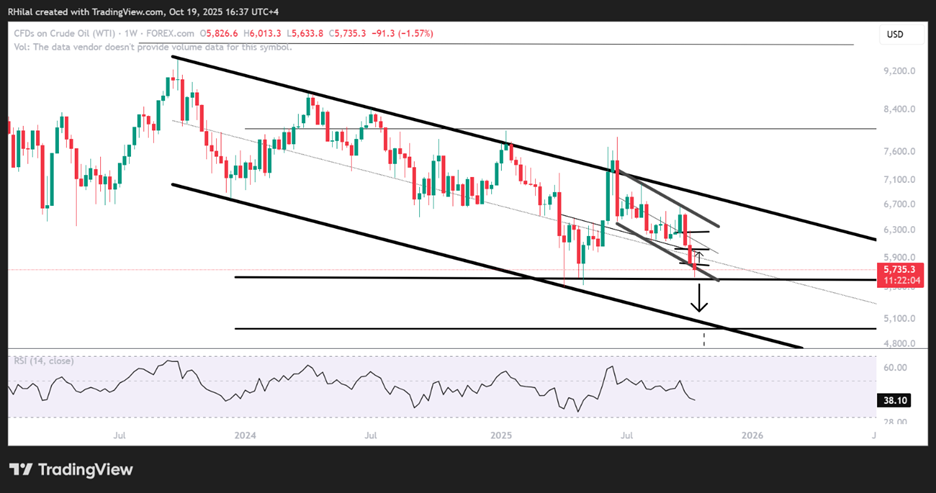
Crude Oil Outlook: Weekly Time Frame – Log Scale
Source: Tradingview
Crude oil prices are tracing another decline toward yearly lows amid oversupply, weak demand, and tariff concerns. New 2025 lows may be reached in the short term, aligning with the lower boundaries of a three-year down trending channel.
The $55 support currently holds as the 2025 low, but a clean break below it could extend losses toward the $49 zone, aligning with the channel’s lower boundary — a potential support area. If this level fails, a deeper selloff could reach the $37 region.
On the upside, should prices recover above $58, a bullish rebound may extend toward $60, $63, and $66, respectively. However, for a sustainable bullish outlook, a decisive breakout above both the three-year downtrend and the $70 resistance is required.
The daily RSI is nearing oversold levels last seen in April 2025, suggesting that downside momentum may soon approach exhaustion.
Crude Oil Outlook: 3-Month Time Frame – Log Scale
Source: Tradingview
New 2025 lows may still form in the short term, aligning with the lower boundaries of a 160-year historical trendline that continues to define crude’s long-term cyclical behavior.
The following chart illustrates crude’s price action dating back to the 1860 lows, respecting the bounds of this 160-year channel. It highlights potential downside targets between $49 and $37, should the $55 level give way.
Written by Razan Hilal, CMT
Follow on X: @Rh_waves






