


As the second week of March comes to an end, it stands out that for the first time in several weeks the cryptocurrency market and the major cryptocurrencies have managed to close the week with positive price movements, highlighting a renewed buying bias that has begun to gain relevance in short-term dynamics.
For now, Bitcoin, as the market’s reference currency, has managed to break again above the 70K level, maintaining a relevant buying bias. This demonstrates a partial recovery in market confidence in recent sessions. If this optimistic sentiment continues, buying pressure could remain relevant for the cryptocurrency market in the coming trading sessions.

Performance of Major Cryptocurrencies
Source: Data - StoneX, Tradingview
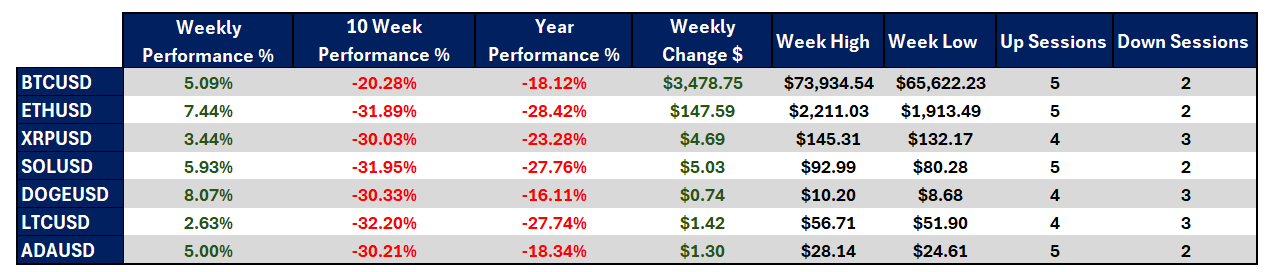
- The cryptocurrency with the strongest appreciation this week is Dogecoin, showing a positive variation of 8.07%, positioning itself as the asset that has managed to recover the most ground in the short term. At the same time, the cryptocurrency that has had the most difficulty posting positive moves is Litecoin, which currently shows a gain of 2.63%, considerably lower than the rest of the market. However, the overall bias across the cryptocurrency market remains bullish for the time being.
- Looking at the last ten weeks, the crypto market continues to trade well below the levels observed at the end of 2025, maintaining a dominant bearish bias in the medium term. During this period, Litecoin has accumulated a decline of -32.20%, making it the cryptocurrency that has struggled the most to recover levels, while Bitcoin shows a loss of -20.28%, demonstrating greater relative stability. Nevertheless, the current recovery is still not enough to fully offset the price losses seen in previous weeks.
- Year-to-date, all major cryptocurrencies continue trading below their opening prices for the year. Litecoin (-27.74%) and Ethereum (-28.42%) continue to lead the declines, while in an interesting shift Dogecoin has begun to stand out with a smaller cumulative loss of -16.11%, positioning itself as the cryptocurrency that has recovered the most ground compared with its peers this year.
- Bitcoin, as the main reference asset for the market, has begun to show larger average variations compared with previous weeks, with a weekly move of approximately $3,400, marking the first consistent buying bias compared with the movements seen in previous weeks. The weekly high reached the $74K area, above the key $70K barrier, finally showing a partial break from the persistent neutrality that had dominated recent weeks.
- In general terms, the week has been positive for the cryptocurrency market and has reintroduced a relevant buying bias in short-term price movements, helping recover part of the losses seen in prior weeks. However, this move can still be interpreted as a temporary relief, since the long-term bias remains in negative territory. The current recovery may not yet be strong enough to change the broader confidence structure of the market, although the current buying pressure could remain relevant in the coming sessions.
Colors from red to green – red for negative correlations and green for positive correlations
Source: Data - StoneX, Tradingview
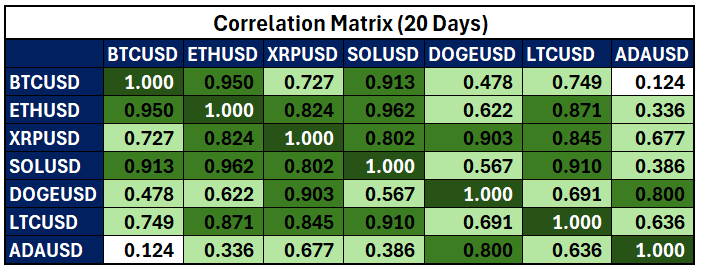
From a correlation standpoint, some cryptocurrencies continue to show divergence from Bitcoin’s movements. This is the case with Cardano, which shows a correlation coefficient of 0.124, and Dogecoin, which maintains 0.478. The rest of the major cryptocurrencies continue to show correlation coefficients above 0.7, reflecting a significant positive correlation with BTC movements over the last 20 days. It is important to remember that correlation coefficients may change over time.
Although correlations remain positive overall, the intensity with which price movements are replicated across cryptocurrencies has declined in recent weeks. This suggests that despite the broader market recovery, some cryptocurrencies have begun to display more aggressive movements than those observed in Bitcoin, indicating that the market is not yet fully aligned.
However, it is also important to highlight that, compared with previous weeks, correlation coefficients have begun to move closer to stronger positive alignment with Bitcoin movements. This indicates that the market recovery appears to be led again by BTC in the short term, which could reinforce renewed confidence in the broader market.
If correlations among the major cryptocurrencies continue to increase consistently, this could signal that positive sentiment is beginning to spread across the market in the coming sessions.
Bitcoin Attempts to Break the Neutral Bias
Source: StoneX, Tradingview
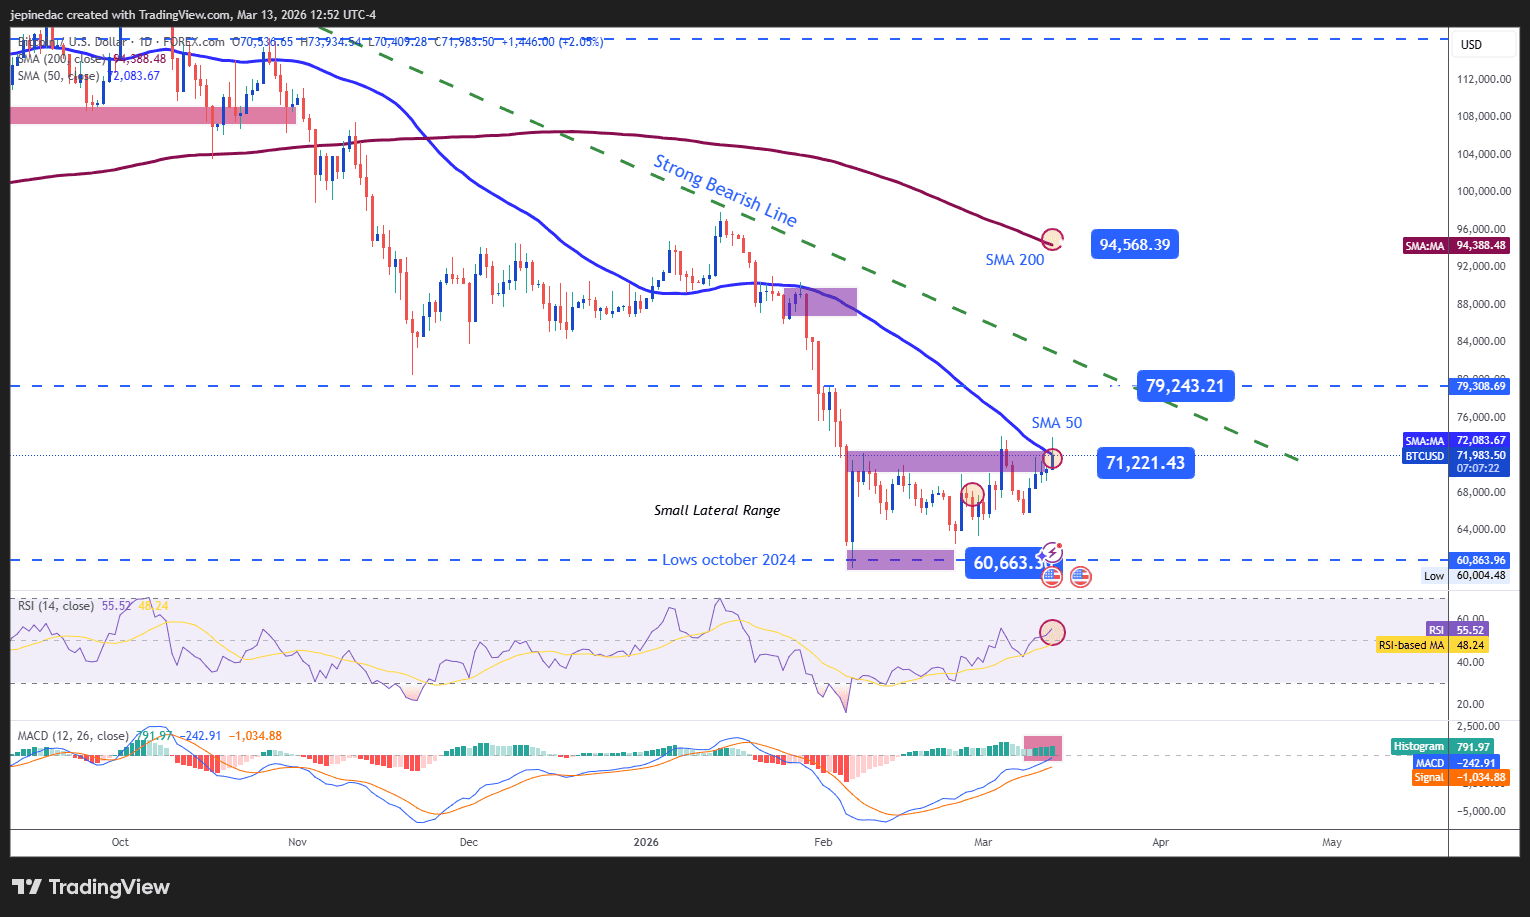
Bitcoin, as the main reference asset in the cryptocurrency market, has traded within a consistent neutrality range in recent weeks, with a ceiling near $70K per BTC and a floor around $60K per BTC.
For now, buying pressure is attempting to consistently challenge the most relevant resistance levels. If this dynamic holds, it could mark the end of the indecision bias and give way to a more meaningful bullish bias in the coming sessions. However, it is important to keep in mind that the current recovery is still not strong enough to break the long-term downward trendline that has remained in place for several months.
Indicators:
- Both the RSI and MACD maintain movements above their respective neutral levels (50 for RSI and 0 for MACD). This suggests that both momentum and the average strength of short-term moving averages currently show a relevant bullish bias. If this behavior continues, it could reflect stronger buying pressure for BTC in the coming sessions.
Key Levels:
- $79,200 – Key Resistance: Area of previous weekly highs located above the 50-period moving average. A sustained breakout could threaten the dominant downward trendline and open the door to a more consistent bullish scenario.
- $71,200 – Near-Term Barrier: Upper boundary of the short-term sideways range. If price fails to move decisively away from this level, the current sideways structure could persist and the recent recovery could come under pressure, reinforcing a phase of indecision.
- $60,600 – Key Support: A level not seen since October 2024. A sustained break below this zone could reactivate the bearish trend and restore dominance to selling pressure.
Litecoin Struggles to Recover This Week
Source: StoneX, Tradingview
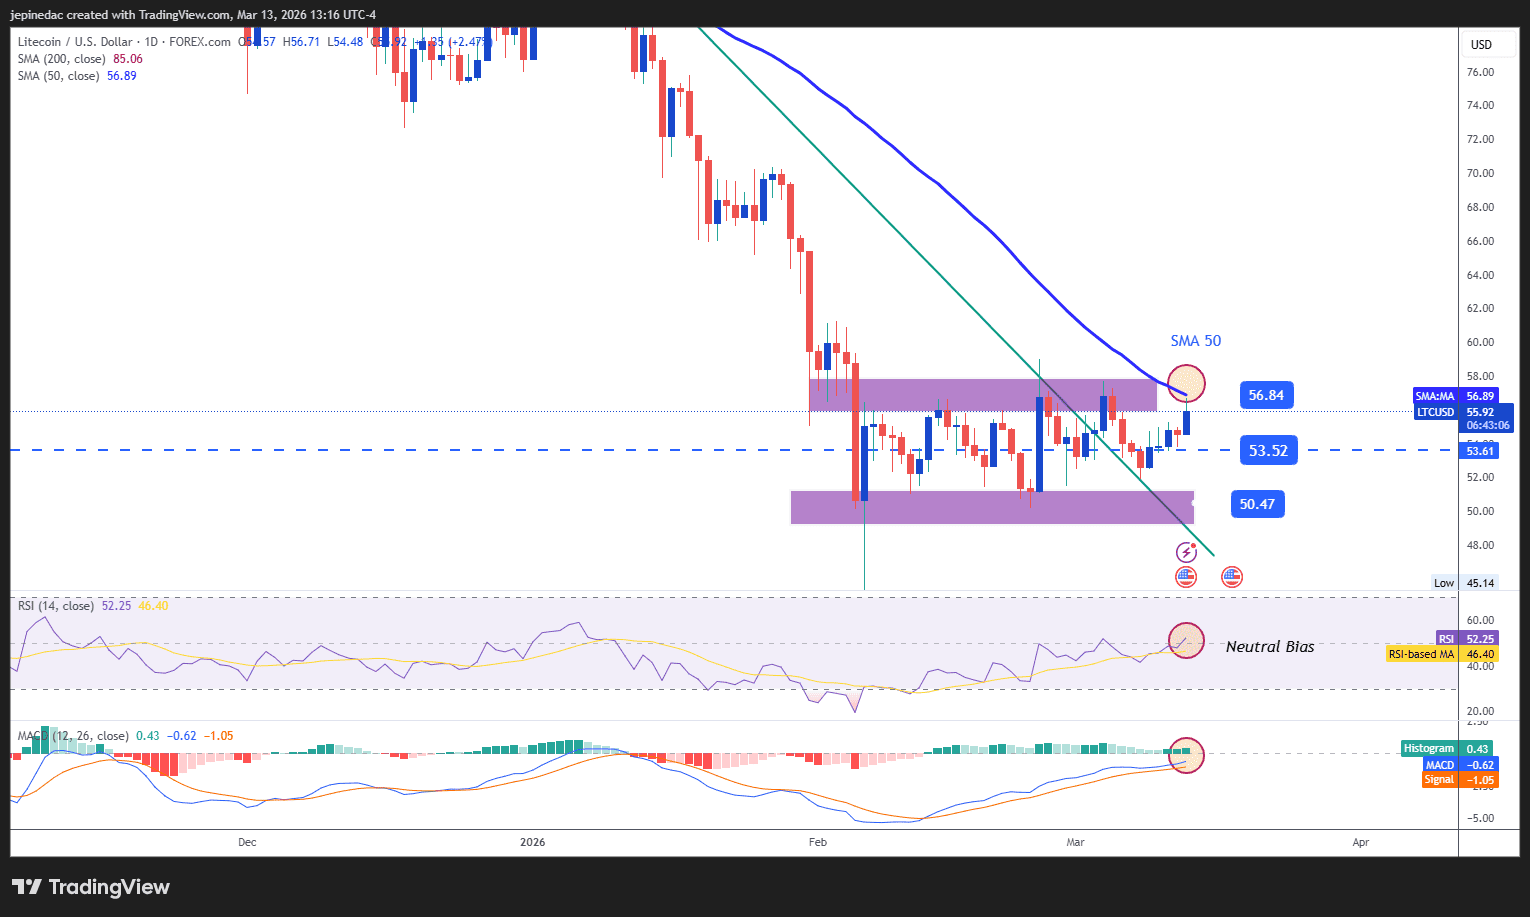
Although Litecoin attempted to maintain a positive bias during the trading week, the recovery remains insufficient to break the consistent neutrality range observed in previous weeks between 56.84 and 50.47. If buying pressure fails to stabilize more consistently, the indecision phase could continue to dominate short-term price action in the coming sessions.
Indicators:
- Unlike Bitcoin, Litecoin’s RSI and MACD remain very close to their respective neutral levels (50 for RSI and 0 for MACD). This suggests that rather than a clear buying bias, the chart reflects a consistent equilibrium between buying and selling momentum, which could prolong the indecision phase if indicators remain near these central levels.
Key Levels:
- 56.84 – Key Resistance: Upper boundary of the current short-term sideways channel and aligned with the 50-period moving average. A sustained breakout could trigger a new bullish bias.
- 53.52 – Near-Term Barrier: Neutral zone located in the middle of the current sideways range. Price action near this level could continue reinforcing market indecision.
- 50.47 – Main Support: Area corresponding to the most relevant recent lows. A move toward this level could reactivate selling pressure and revive the broader downward trend seen in previous weeks.
Written by Julian Pineda, CFA, CMT – Market Analyst
Follow him on: @julianpineda25






