


The Dow Jones Index has attempted to sustain a gain of more than 0.4% during the latest trading session, maintaining a consistent bullish bias as the market looks optimistically toward today’s U.S. central bank decision, scheduled for December 10. For now, the index remains attentive to the Federal Reserve’s comments, which may reveal whether a flexible monetary policy could continue into 2026. If confirmed, this scenario could support continued buying pressure in the Dow Jones over the coming sessions.

The Day of the Federal Reserve Arrives
Today marks the Federal Reserve’s long-awaited rate decision, and optimism in the equity market has remained steady, largely because there is a high probability of a rate cut from 4.00% to 3.75%. This potential cut has strengthened confidence in indices such as the Dow Jones, which has returned to levels near its all-time highs. In general terms, a lower interest rate reduces borrowing costs in the U.S. economy, encouraging consumption and investment, which supports the performance of the companies that make up the Dow and boosts short-term market confidence.
However, the key factor will be whether this confidence can be sustained through the end of the year. Markets had already priced in this cut, but the real question is whether the same outlook will hold throughout 2026. One of the most important elements influencing this expectation is the recent trajectory of inflation in the United States: after hitting a low of 2.3% in April, inflation has risen steadily, reaching 3.00% in September. This persistent upward trend moves inflation away from the Federal Reserve’s 2.00% target and could become an obstacle that prevents the central bank from committing to a prolonged period of lower rates.
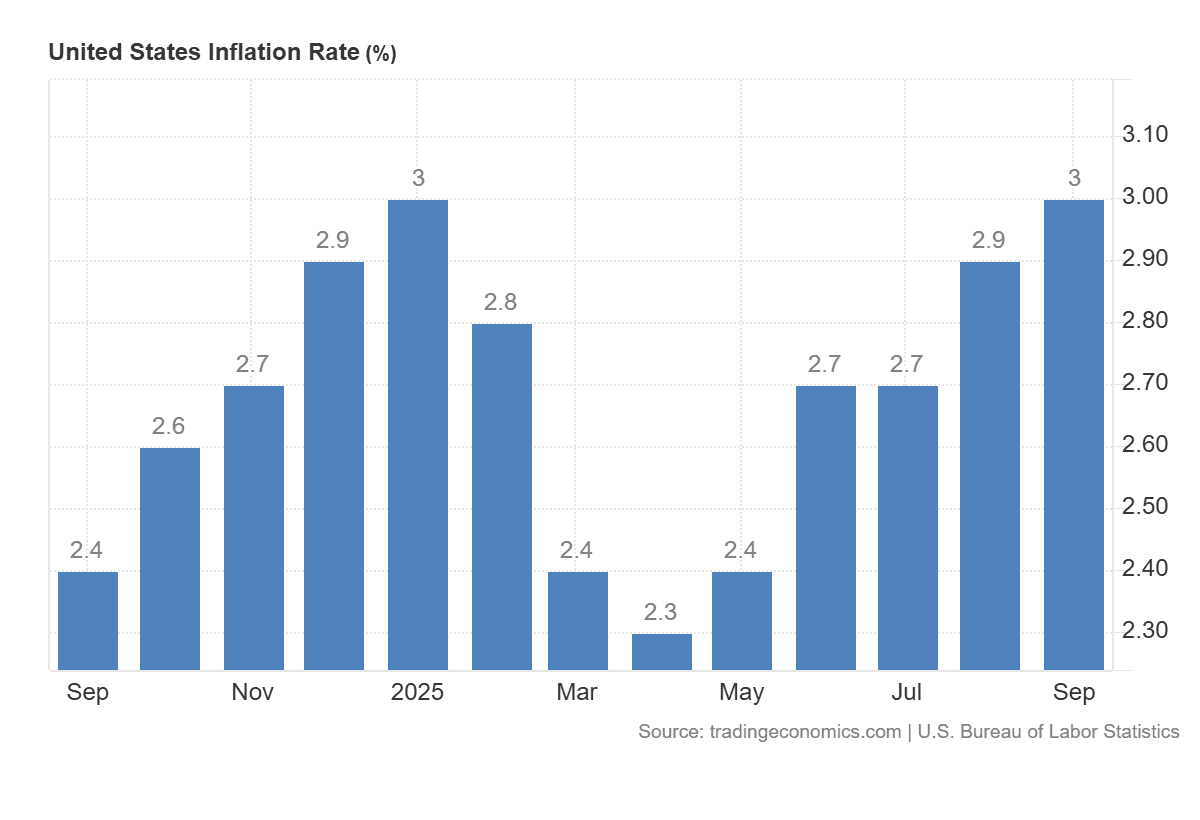
Source: TradingEconomics
Indeed, the CME probability model already reflects this uncertainty. It projects only one additional rate cut below 3.75% by June 17 of next year, with a 41.5% chance of reaching 3.5%. Beyond that date, the market anticipates a relatively stable rate environment throughout the first half of 2026. This outlook may become clearer after the Federal Reserve’s commentary following today’s decision.

Source: CMEGROUP
With this in mind, short-term confidence in the index will largely depend on the tone the central bank adopts in the coming hours. If a scenario of further upcoming rate cuts is confirmed, it could act as a catalyst to maintain stable demand for the Dow Jones. However, if the comments suggest a more neutral stance for 2026, confidence may weaken and renewed selling pressure could return to the index in the days ahead.
Dow Jones Technical Outlook

Source: StoneX, Tradingview
- Neutrality Begins to Emerge: Over recent weeks, the Dow Jones has sustained consistent buying pressure, but this has not yet been enough to break above its all-time highs. Recent price action has shown signs of neutrality in the latest candles, casting doubt on the index’s ability to preserve the long-term bullish trendline that dominated the second half of 2025. If this neutral behavior persists, a sideways range may form toward year-end, especially if the price fails to regain strong directional momentum while the market awaits the Federal Reserve’s announcements.
- RSI: Although the RSI continues to fluctuate above the neutral 50 zone, recent sessions have shown a flattening slope, indicating a balance between buying and selling impulses. If the RSI does not begin to strengthen, this neutral price environment may continue in the coming sessions.
- MACD: The MACD remains very close to the zero line, suggesting that short-term moving-average strength is neutral. This could lead to a period of price indecision, particularly if stronger directional signals do not emerge following the central bank’s remarks.
Key Levels:
- 48,266 points – Key resistance: This level corresponds to the all-time highs and represents the most important bullish barrier in the short term. A move toward this level could revive a dominant bullish bias and reinforce the uptrend observed in the second half of 2025.
- 46,688 points – Nearby barrier: This level corresponds to a recent pullback zone and aligns with the 50-period simple moving average. If price remains near this area, market indecision may increase, consolidating a short-term sideways range.
- 45,815 points – Key support: This level marks a recent low and coincides with the 23.6% Fibonacci retracement. A break below it could trigger a new bearish trend, strengthening selling pressure in the short term.
Written by Julian Pineda, CFA, CMT – Market Analyst
Follow him at: @julianpineda25






