Next Plc FY earnings preview
Next Plc will report full-year results on 26 March. This comes as the share price, which was trading at record highs in November, has struggled to regain those levels despite repeated upgrades to guidance.
In its January trading update, Next raised its full-year sales forecast by 10.7% growth, taking revenue to £5.6 billion, up from previous guidance of 9.7% growth (£5.55 billion). Profit before tax was expected to rise by £30 million to £1.13 billion.
Despite a weak consumer backdrop ahead of the November budget, Next continued to outperform. In January, it again upgraded guidance, lifting profit expectations by £15 million to £1.15 billion — a 13.7% year-on-year increase. Full-price sales are expected to come in at £5.16 billion, up 10.7%.
The focus will be on the outlook, particularly given expectations of higher interest rates following a more hawkish Bank of England and ongoing geopolitical risks which are adding inflationary pressures. Consumer confidence could deteriorate amid a challenging economic backdrop which could hurt the outlook from here
How to trade Next earnings
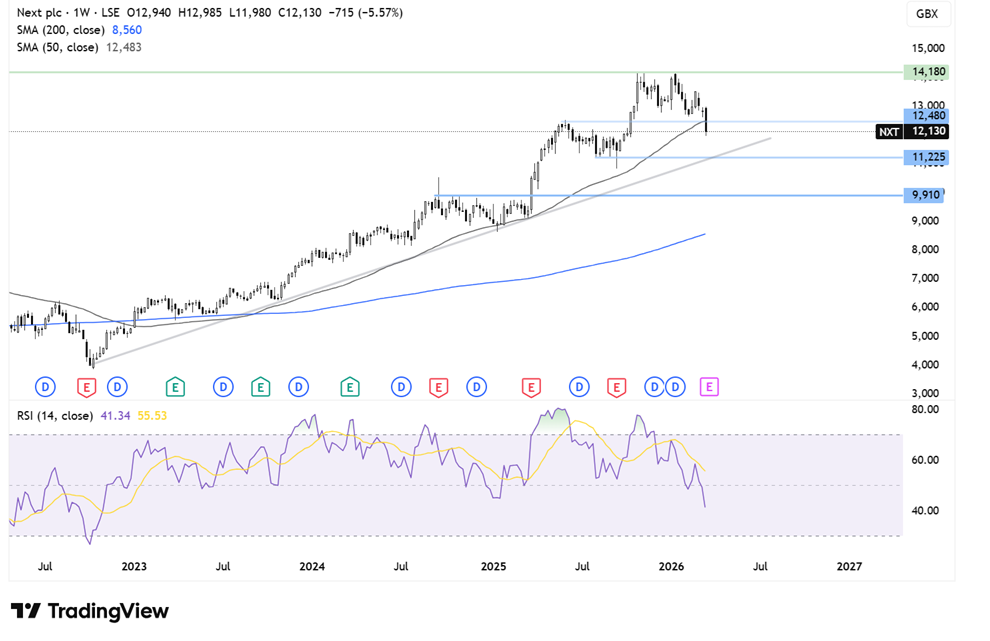
On the weekly chart, Next has been in a long-term uptrend since October 2022, forming higher highs and higher lows. However, it ran into resistance at a record high of 14,180 in early January, forming a potential double top before reversing lower.
The price has broken below the 50-day SMA and key support at 12,500. While the longer-term uptrend remains intact, attention now turns to 11,200 — a key level combining trendline and horizontal support.
A recovery would need to reclaim the 12,500 level to bring 14,180 back into focus.
Kingfisher FY results preview
Kingfisher last reported in November, boosting its share price after upgrading full-year profit guidance to £540–£570 million. Free cash flow guidance remained unchanged at £480–£520 million.
Regionally, the UK and Ireland performed well, with like-for-like sales up 3%, supported by B&Q and Screwfix. However, France remained a drag, with a 2.5% decline in like-for-like sales.
Despite concerns over softening market conditions at the time, the share price reached a five-year high. Since then, it has fallen amid concerns over the UK outlook, rising fuel costs, inflationary pressures, and weaker consumer spending prospects.
Kingfisher’s results come ahead of UK retail sales data on Friday which will also provide some insight into how the consumer was holding up before the Iran war started.
How to trade Kingfisher results
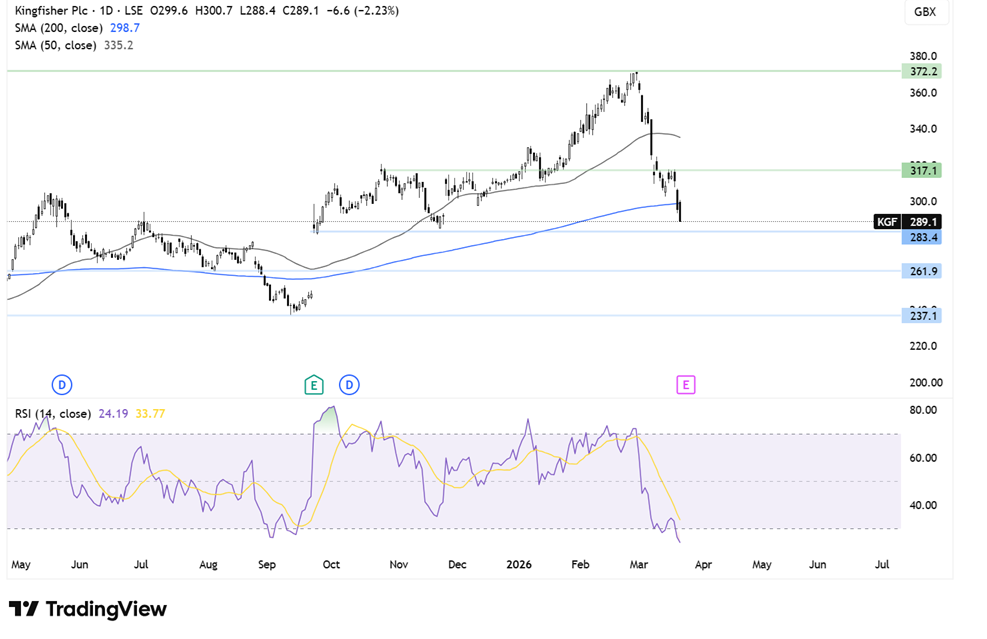
After rising to a high of 372 in late February, the price reversed lower, falling below both the 50-day and 200-day SMAs (around 288).
The RSI has eased from overbought levels, suggesting further consolidation or downside risk.
A break below 285 (November low) could open the door to 260 and then 235 (September low). On the upside, a move back above the 200-day SMA near 300 would bring 317 resistance into focus.
BYD EY earnings preview
BYD, the world’s largest EV maker, will report full-year earnings this week. This comes as Chinese automakers nearly doubled European sales in February, capturing an 8% market share.
Investors will be watching whether this trend is benefiting BYD, which is shifting from domestic volume growth towards global expansion and margin improvement.
The company is increasingly focused on international manufacturing rather than exports from China. It is also targeting the European premium market, aiming to compete with brands such as BMW and Porsche, including new EVs with ultra-fast charging capabilities.
BYD’s China sales fell sharply, down 41% year-on-year in February — the biggest decline in five years. In contrast, overseas sales have surged, with UK and European sales more than tripling last year to 190,000 units, giving it a 1.7% market share in Europe and 2.4% in the UK.
How to trade BYD earnings
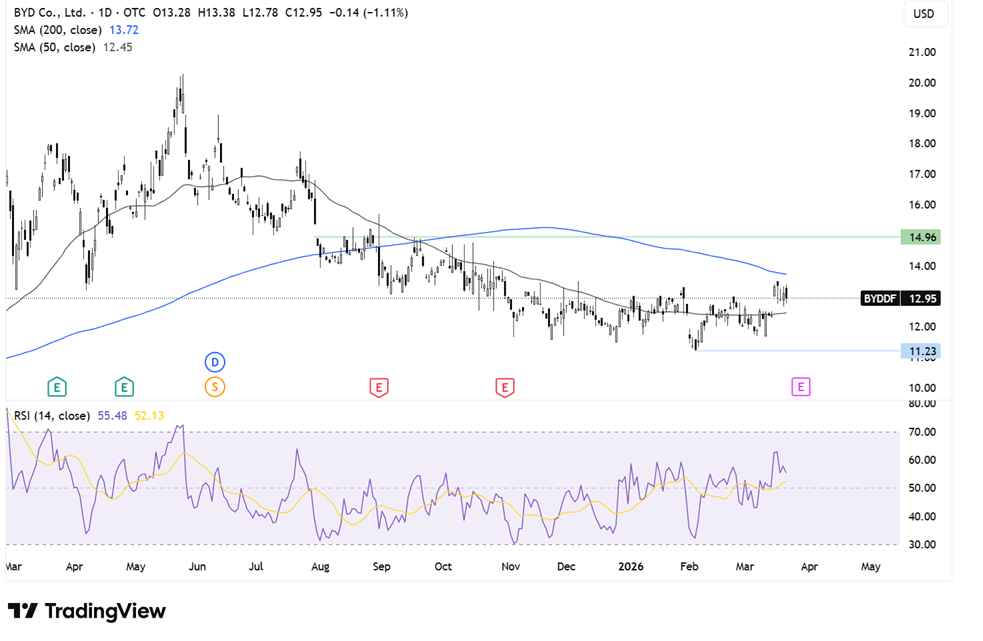
BYD has been in a downtrend since July last year, falling to a low of 11.20 The price has since recovered above the 50-day SMA but remains below the 200-day SMA at 13.7.
A break above the 200-day SMA would bring 15.0 into focus. On the downside, a move below the 50-day SMA near 12.50 could expose 11.62 (March low), followed by 11.20.