

The trading week continues to unfold and the latest session has once again highlighted weakness around the euro against the U.S. dollar. EUR/USD is down nearly 0.3%, reflecting that the European currency continues to struggle to sustain a consistent recovery in the short term.
However, beyond today's decline, what is becoming increasingly evident is the development of a relatively stable phase of neutrality within the chart. Much of this behavior continues to be driven by uncertainty surrounding the future path of Federal Reserve monetary policy. The latest CPI inflation data in the United States have once again brought the possibility of a relatively more aggressive central bank back into focus, making it difficult for the market to establish a clear direction. As long as this catalyst remains relevant, the indecision observed recently could continue to be an important feature of EUR/USD price action.

What happened with the CPI release?
Markets received the latest U.S. monthly inflation figures through the publication of CPI m/m and Core CPI m/m, indicators designed to measure inflationary pressures during October.
Both readings came in slightly above expectations. CPI m/m was reported at 0.4%, compared with the 0.3% forecast, while Core CPI m/m reached 0.3%, above the 0.2% expected by the market.
Beyond the surprise itself, the key takeaway is that inflation continues to show resilience and has yet to demonstrate a consistent slowdown. This reinforces the view that inflation remains one of the primary challenges facing the Federal Reserve.
The data become even more relevant when combined with last Friday's stronger-than-expected NFP report. A resilient labor market alongside persistent inflation continues to reinforce the idea that the U.S. economy may still provide enough room for the Federal Reserve to maintain a relatively aggressive stance over the coming months.
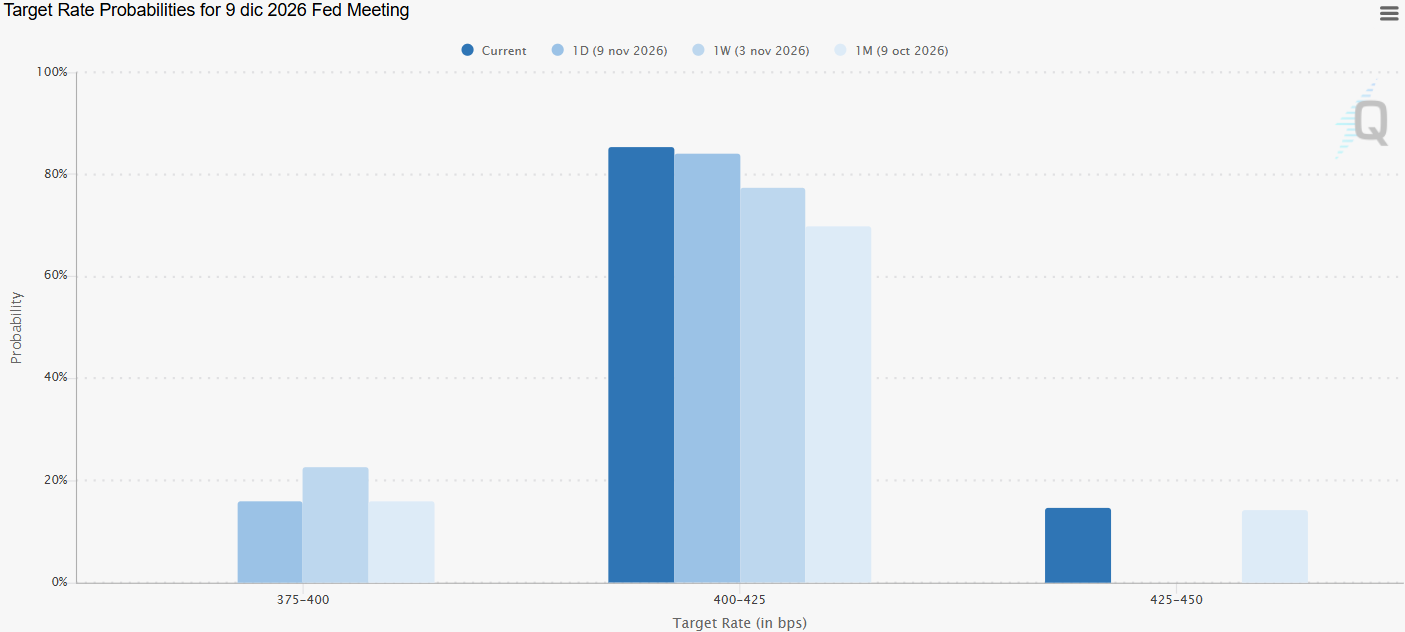
This perception continues to be reflected in market expectations. At the moment, the probability of a rate hike at the Fed's December 9 meeting remains close to 85%, up slightly from 84% during the previous session, reflecting that investors continue to price in an increase from the current 4.00% rate to 4.25% before year-end.
Source: CMEGROUP
What is becoming particularly important, however, is the way these expectations are feeding into the bond market. As the prospect of higher rates for longer gains traction, investors are demanding higher yields to hold U.S. fixed-income assets.
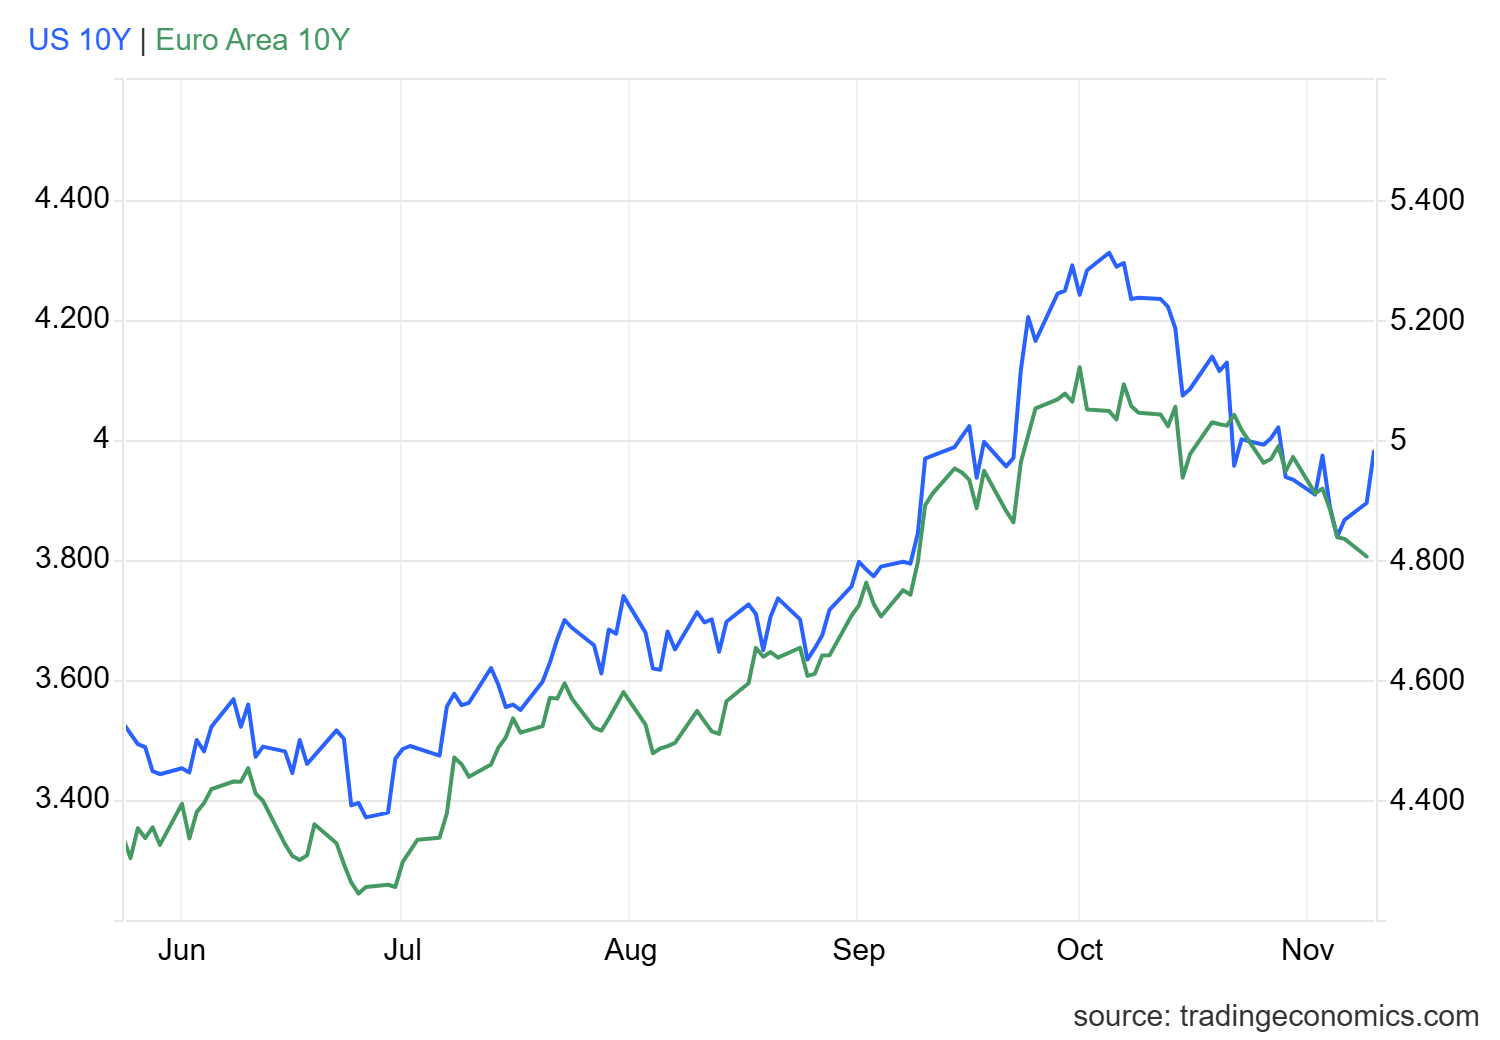
This effect can already be seen in the behavior of the 10-year U.S. Treasury yield, which has recovered ground during the session and is once again approaching the 5.00% area. In contrast, European 10-year bond yields continue to trade closer to the 3.8% area and maintain a relatively weaker trend.
Source: TradingEconomics
This divergence is important because it widens the yield differential between the two regions. As U.S. yields become increasingly attractive relative to European yields, dollar-denominated investments may continue to offer stronger relative appeal than euro-denominated assets.
In part, this dynamic helps explain why the euro continues to struggle to regain ground consistently in the short term. As long as this divergence remains in place and markets continue to anticipate a Federal Reserve that is potentially more aggressive than the European Central Bank, it is possible that a more consistent phase of indecision, or even renewed weakness, could continue to characterize EUR/USD trading in the sessions ahead.
EUR/USD Technical Forecast
Source: StoneX, Tradingview
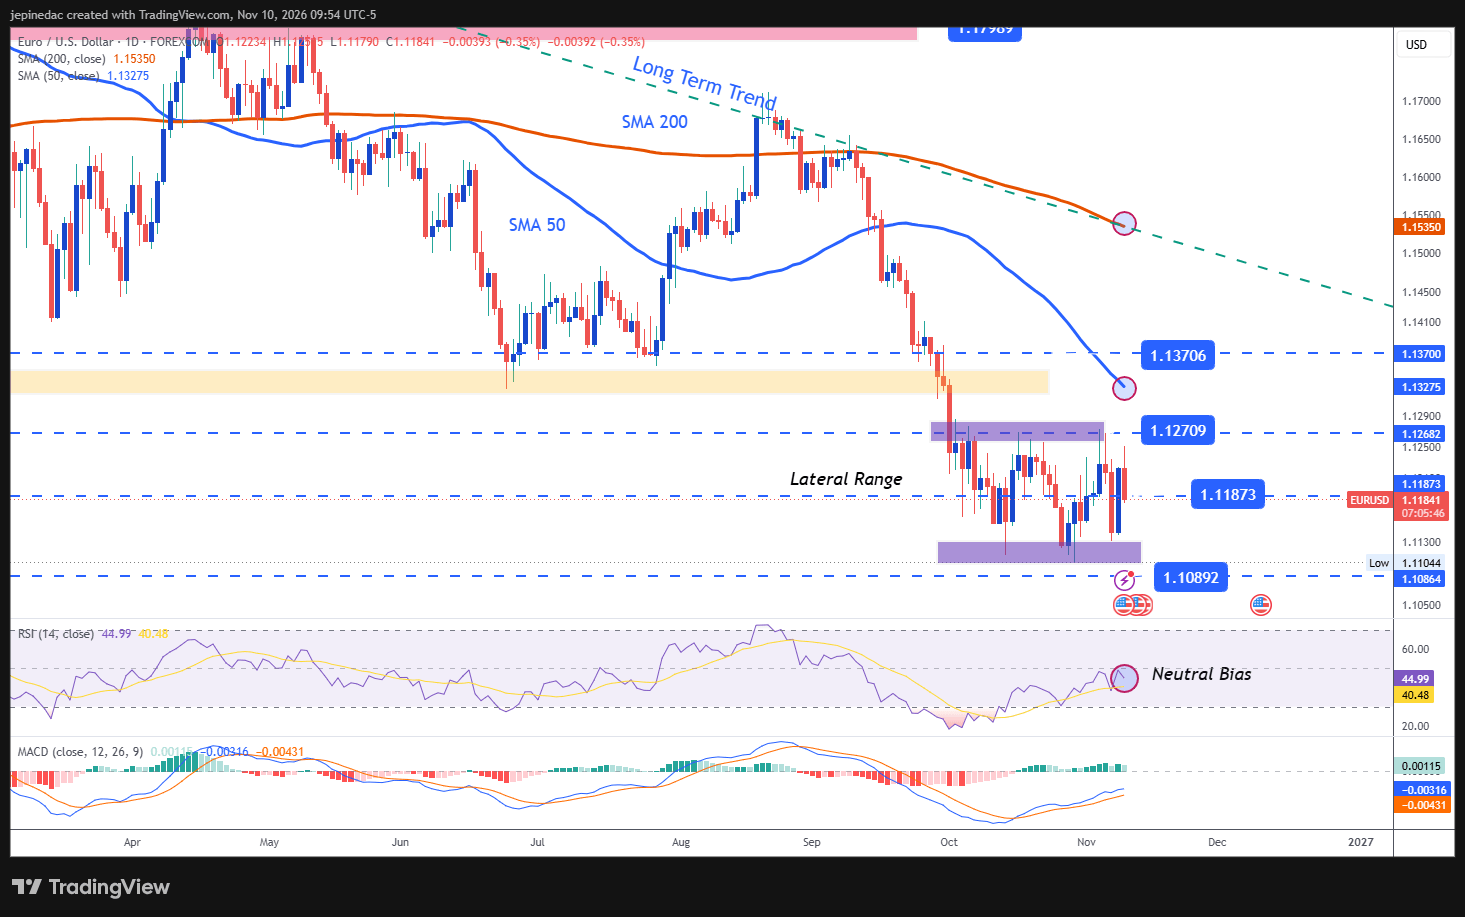
- Indecision is becoming increasingly evident: Although the dominant technical structure remains the long-term bearish trendline that has guided EUR/USD price action for several months, recent movements have gradually shaped an increasingly visible trading range. For now, this range-bound structure becomes the most important technical pattern to monitor and, unless price manages to break key levels, it could continue dominating the pair's behavior in the coming sessions.
- RSI: The RSI has moved closer to the 50 neutral level, reflecting a relatively stable balance within short-term momentum. This reading supports the view that a phase of indecision continues to gain relevance on the daily chart.
- MACD: A similar scenario can be observed in the MACD, whose histogram continues to fluctuate near the 0 neutral line. This also reflects balance within short-term moving-average strength and reinforces the idea of a market that lacks a clearly dominant direction.
Key Levels:
- 1.12709 – Key Resistance: A significant high observed several weeks ago that currently represents the main upside barrier on the chart. Price action managing to break above this level consistently could begin to restore a more meaningful bullish bias in the short term.
- 1.11873 – Near-Term Barrier: A retracement area observed throughout recent weeks that currently acts as the most important equilibrium level on the chart. As long as price remains close to this reference, a relatively stable phase of indecision could continue to support the current range-bound structure.
- 1.10892 – Key Support: A level not seen since May 2025 that continues to act as the most important downside barrier within the current structure. Price action returning toward this area could restore seller dominance and favor a more consistent extension of the broader bearish trend in the weeks ahead.
Written by Julian Pineda, CFA, CMT – Market Analyst
Follow him on: @julianpineda25