


EUR/USD Talking Points:
- EUR/USD bears had an open door this week and while they were able to push a series of fresh lows, the threat from President Trump to fire Jerome Powell brought question to further USD-strength. And then a dovish comment from Waller on Friday saw USD continue to claw back prior week gains.
- EUR/USD is testing the 1.1663 resistance level looked at on Tuesday, and this sets up a big test at another spot about 20 pips higher. The 1.1686 level is a Fibonacci retracement that’s been in-play for the past few weeks, and it’s now confluent with the 23.6% retracement of the recent move. The weekly open of 1.1690 highlights another line in the sand and if buyers can close this weekly bar as a doji, it’ll look like a failure from sellers that opens the door for bullish scenarios into next week.
- I’ll be looking at updated charts for both the USD and EUR/USD in the weekly webinar, and you’re welcome to join. Click here to register.

The true test of trend isn’t what happens when matters are easy – it’s what happens on the pullbacks or retracements. For budding up-trends, the question is whether buyers want to come in after a dip, after prices sell-off. If they do, well then we can have higher-low support and that illustrates an element of bullish anticipation, which can then lead to higher-highs and a continuation of the topside trend. On the other side of the matter, if sellers are able to stretch prices lower, that can be a positive indication for bearish trends, but perhaps more pertinent is whether that bearish aggression remains after a pullback, whether shorts come in to defend lower-highs (particularly if at a spot of prior support), which can then allow for the bearish trend to continue.
That’s where we’re now at on EUR/USD. While the pair rallied into the end of Q2 with a fresh three-year high as RSI went overbought on both the daily and weekly charts, it’s been a change of pace so far in Q3. And the way that this has all went down has been really interesting.
I talked about this in-depth during the Tuesday webinar, highlighting the fact that, so far, the Q3 pullbacks in both USD and EUR/USD have been relatively minor in the big picture. I also said (in the section around the S&P 500) that I expected President Trump to take interest in the matter, threatening to fire Jerome Powell as the Fed had so far refused to cut rates. Given the inflation data, it makes sense as to why they might not want to, especially considering the response to inflation after they cut rates by 100 bps at the end of last year. The Fed continues to say that it’s fear from inflation from tariffs but realistically, the evidence of what’s happened has to weigh on many members of the bank.
That threat to fire Powell showed less than 24 hours later and this led to a massive sell-off in the USD. The threat didn’t last for long and as I’ve said, I don’t think Trump actually wants to fire Powell as he would lose a very easy scapegoat should either the economy or stock market take a turn for the worse; not to mention the fact that it’s highly questionable as to whether he could actually push it through. But the simple threat was enough to shake markets as it brought up the prospect of a more dovish Fed that would be more willing to cave to Trump’s dovish desire. It helped to boost stocks and drawdown the USD, and on Friday, we heard from one of the more dovish members of the FOMC when Christopher Waller reiterated that he’s ready to cut rates, further driving down the USD.
The big question now is whether markets agree, and that’s what speaks to the topic I opened this article with: Whether sellers in the USD are willing to punch through the supports that have, so far, built a bullish trend in Q3. Or perhaps more relevant to the Euro, whether bears in EUR/USD no longer want to show resistance at prior supports, at levels like 1.1663 or 1.1686.
EUR/USD Four-Hour Chart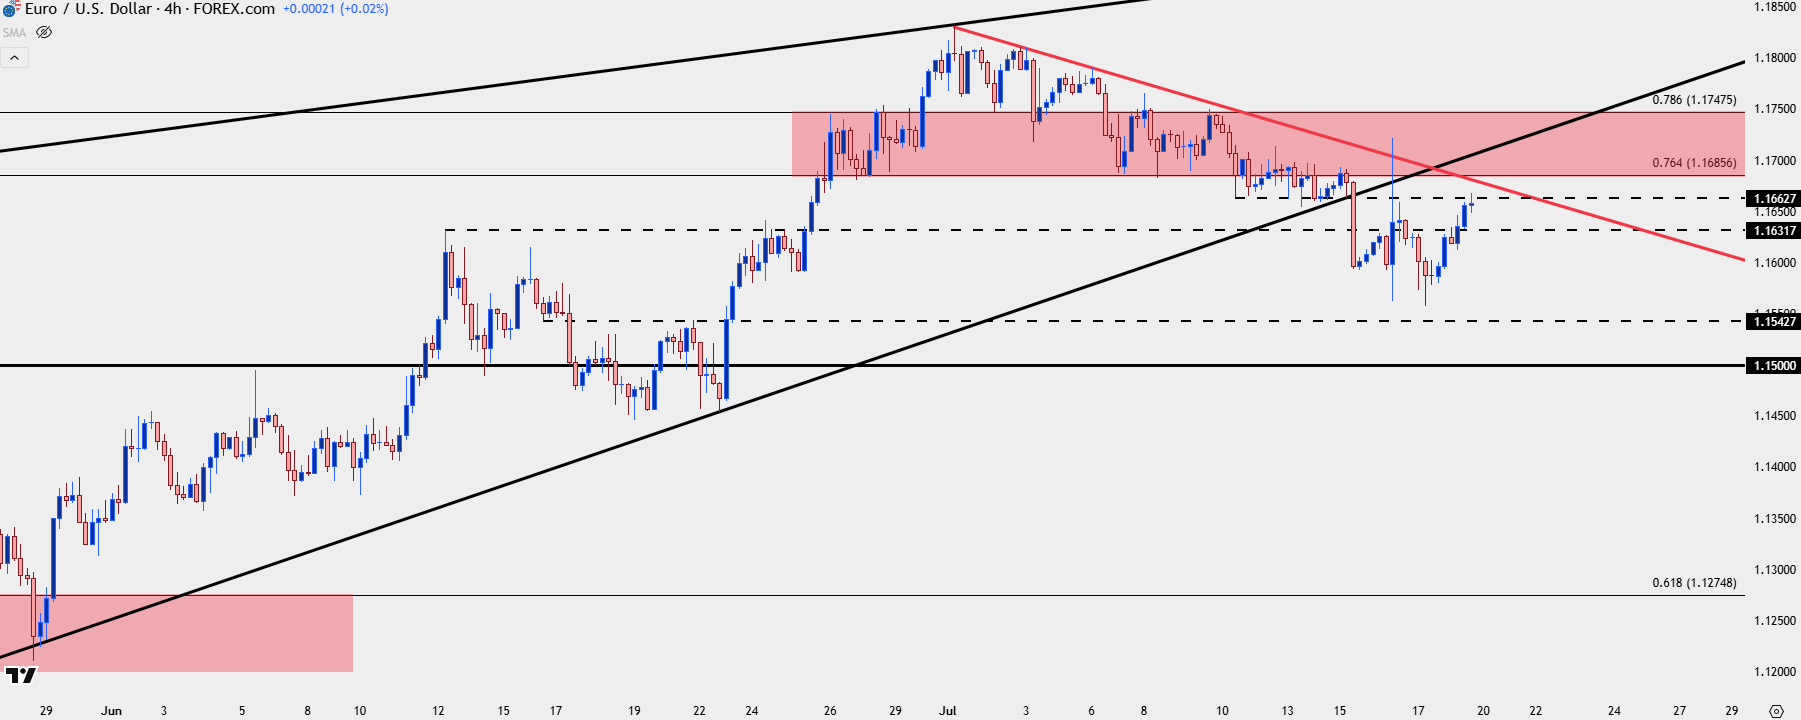
Chart prepared by James Stanley; data derived from Tradingview
EUR/USD Weekly
Weekly bars are important for bigger picture trends and the current setup in EUR/USD is illustrative of that. The rising wedge formation that led to breakdown earlier in the week shares some confluent with that 1.1686 level. If the weekly bar closes above that price, it’ll look like a large failure from sellers, and this could fast put buyers back in the driver’s seat for near-term trends. Of course, the next question after that is whether bulls can contend with resistance at 1.1748 or the 1.1830 level that turned around the advance a couple weeks ago, but the way this week’s candle finishes is of interest for that theme.
EUR/USD Weekly Chart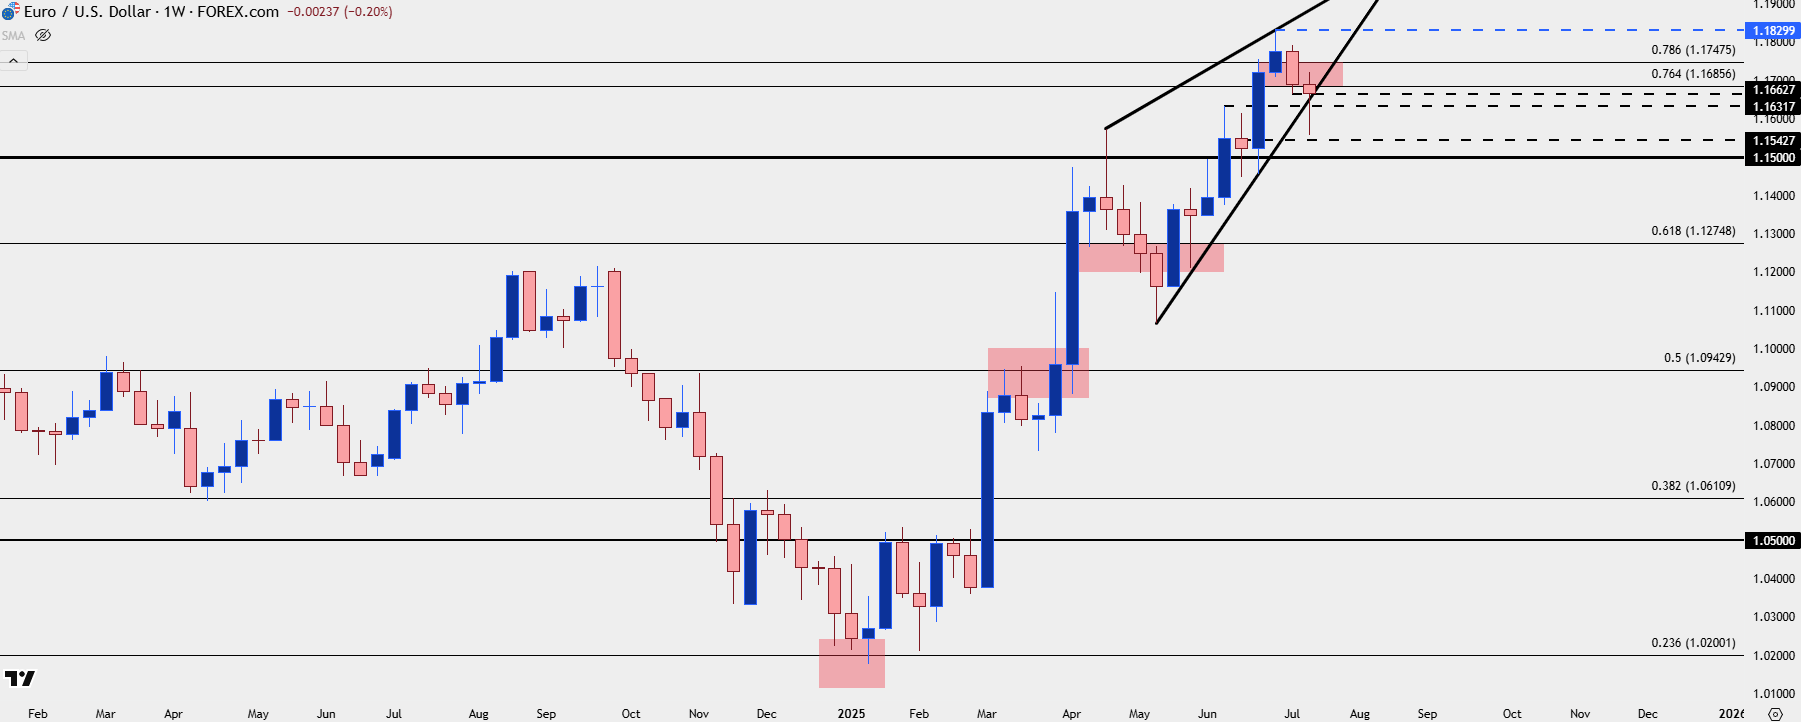
Chart prepared by James Stanley; data derived from Tradingview
EUR/USD Daily
The daily chart below helps to illustrate some important levels and these are the same that I had looked at on Tuesday in the webinar. The 1.1663 and 1.1686 prices are most pertinent, near-term, but above that, we also have the Fibonacci level that was resistance late last week at 1.1748 and above that, the 1.1830 level where the rally started to stall on the first day of Q3 trade.
The Fed is in blackout next week ahead of their July rate announcement so that means we shouldn’t have any dovish pushes from FOMC members like Michelle Bowman or Christopher Waller. That can be a great time to get a read on price action and how market participants are going to push trends as we move towards that next Fed meeting.
EUR/USD Daily Price Chart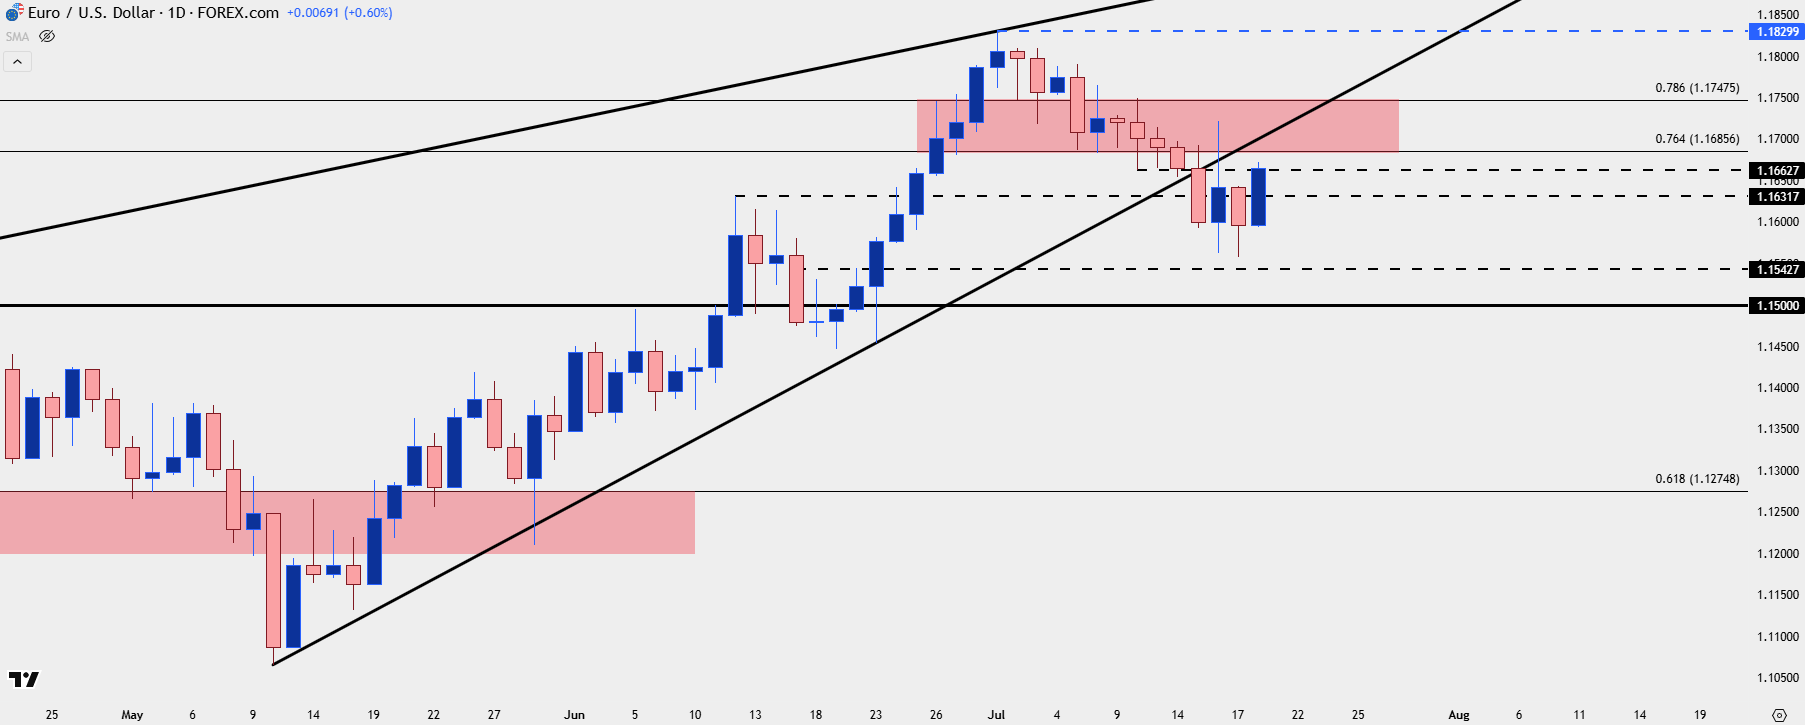
Chart prepared by James Stanley; data derived from Tradingview
--- written by James Stanley, Senior Strategist






