


Asian Indices:
- Australia's ASX 200 index fell by -11.1 points (-0.15%) and currently trades at 7,235.00
- Japan's Nikkei 225 index has risen by 564.29 points (1.7%) and currently trades at 33,753.33
- Hong Kong's Hang Seng index has risen by 87.45 points (0.45%) and currently trades at 19,394.04
- China's A50 Index has fallen by -18.52 points (-0.15%) and currently trades at 12,709.49
UK and Europe:
- UK's FTSE 100 futures are currently down -1 points (-0.01%), the cash market is currently estimated to open at 7,526.26
- Euro STOXX 50 futures are currently up 4 points (0.09%), the cash market is currently estimated to open at 4,402.15
- Germany's DAX futures are currently up 23 points (0.14%), the cash market is currently estimated to open at 16,104.04
US Futures:
- DJI futures are currently down -3 points (-0.01%)
- S&P 500 futures are currently down -1.75 points (-0.04%)
- Nasdaq 100 futures are currently down -16.75 points (-0.11%)

ISM manufacturing data was weaker than expected, contracting at its fastest pace since the pandemic, with employment and new orders also contracting.
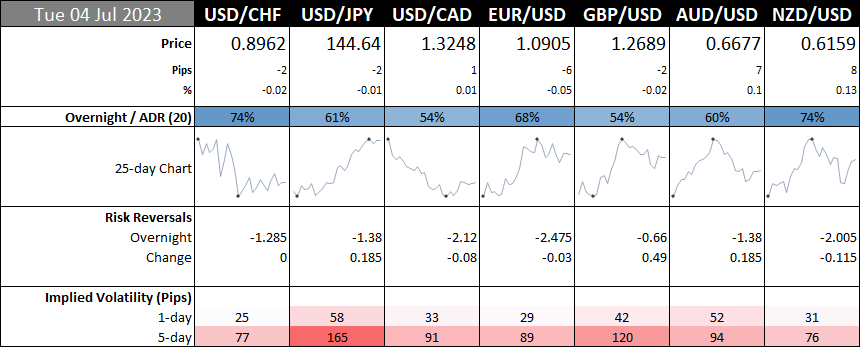
Whilst weaker ISM manufacturing data initially weakened the US dollar in yesterday’s US session, the moves were effectively reverse across all FX majors to leave a series of indecision days during low-liquidity trade. With US traders set to return to their desks today then trading volumes are expected to pick up, although a lack of US economic data could keep volatility capped until later in the week.
In fact, we have no top-tier data in the European session either, which means traders may want to refer to lower timeframes to seek opportunities around support and resistance levels until data (and potential volatility) picks up.
Futures markets are mixed with DAX and Stoxx 50 trading slightly higher from yesterday’s close, whilst the Dow Jones, FTSE 100, S&P 500 and Nasdaq 100 trade slightly lower. European bourse pulled back from Friday’s highs on Monday during light trade, looking past the strong lead form Asia (which was responding to weak inflation data from the US on Friday). Asian equity markets were also mixed overnight with the majority trading in small ranges and handing back some of yesterday’s gains.
EUR/USD daily chart:
EUR/USD formed a 2-bar bullish reversal on Friday (bullish piercing line) thanks to softer US inflation and CPI expectations on Friday. The euro has continued to hold above the 50-day EMA on a closing basis and lower wicks suggests demand around 1.830/40.
However, whilst a potential bull-flag could be forming on the daily chart, implied volatility levels are low - which is in line with the time of year. So unless a fresh catalyst arrives, range-trading strategies may be preferably
EUR/GBP rose for a second week, although it was the third weekly candle with higher wicks (which accounted for the majority of the week’s range), to form inverted hammers. Ultimately, it is hard to say whether they’re bullish reversal or bearish continuation candles until we see a clear break of their highs or lows. Although price action on the daily chart appears to be a corrective rise, which could indicate a pending top and eventual break lower in line with its bearish daily trend.
GBP/USD formed a three-day bullish reversal (morning star reversal) on Friday although prices pulled back on Monday slightly. Whilst we see the potential for GBP/USD to revert to its bullish trend and head for 1.2800, we see the potential for another initial dip lower – and looking for evidence of support around the weekly pivot point / May high (1.2664/7) or volume cluster around 1.2575 before its next leg higher

WTI crude oil daily chart:
WTI crude oil failed to hold on to gains made yesterday, following news that Saudi Arabia will extend their production cap and Russia are to reduce output. A bearish hammer formed on the daily chart which respected the 50-day EMA as resistance. The fact that large speculators and managed funds have continued to increase their net-short exposure to oil in recent weeks continues to suggest rallies could be faded (sold short into), and any moves from OPEC member to cut supply is seen as more of a supporting feature in prices, but not enough to justify being aggressively long. Therefore, it may be preferably for traders to consider range-trading strategies and seek bearish opportunities around resistance levels or bullish setups around support. With prices meandering around $70, we may need to be patient to try and capture some mean reversion around the highs or lows between the $67 - $73 range on the daily chart, or refer to lower timeframes to try and capture smaller moves.


View the full economic calendar
-- Written by Matt Simpson
Follow Matt on Twitter @cLeverEdge






