EUR/USD, Gold, US Dollar Talking Points:
- It’s been a busy couple of days across markets with this morning bringing a large move in the FX-space as USD-strength came roaring back, helped along by a bearish push in the Euro around the ECB rate decision.
- Out of the United States we got both Durable Goods data as well as Advance Q2 GDP, both of which massively beat expectations. Given that Chair Powell had echoed a tone of data dependency at yesterday’s FOMC rate decision, this put upward pressure on rates as markets started to factor in hawkish potential around the FOMC.
- This is an archived webinar that we host every Tuesday at 1PM ET. If you’d like to register, it’s free to do so from the following link: Click here to register.
While there was rejoicing yesterday that the FOMC may be closer to that pause point with rates, this morning brought a reminder that US data has remained fairly strong, all factors considered. This morning was particularly busy as there was the European Central Bank rate decision scheduled for 8:15 with the press conference to begin at 8:45. And at 8:30 there were a couple of key US data points released with both Durable Goods and Advance Q2 GDP, both of which beat expectations.
For GDP, the expectation was for a 1.8% print and that came out at 2.4%; and Durable Goods was expected to come in at 1% and instead printed at a whopping 4.7%. These are both bullish factors that adds some context to yesterday’s rate decision at the Fed, where Jerome Powell took on a tone of data dependency that deductively brought a dovish expectation to markets, given the drop in the USD that showed in the aftermath of that rate decision.
A little more than 24 hours later and the entirety of that loss has been erased, and then some. The US Dollar has quickly pushed up to a fresh two-week high and is now approaching a key spot on the chart at 102. As I had looked at throughout the past week, this level would be a big test for USD bears as it was a spot of prior support and could retain resistance potential upon re-test.
From the daily chart, however, bulls have so far made a loud statement today as the current daily bar is showing as an outside bar, which is similar to a bullish engulfing pattern but this includes full coverage of the prior candle, wicks included, whereas the engulf is largely just concerned with the candle body.
US Dollar - DXY Daily Price Chart (indicative only, not available on Forex.com platforms)
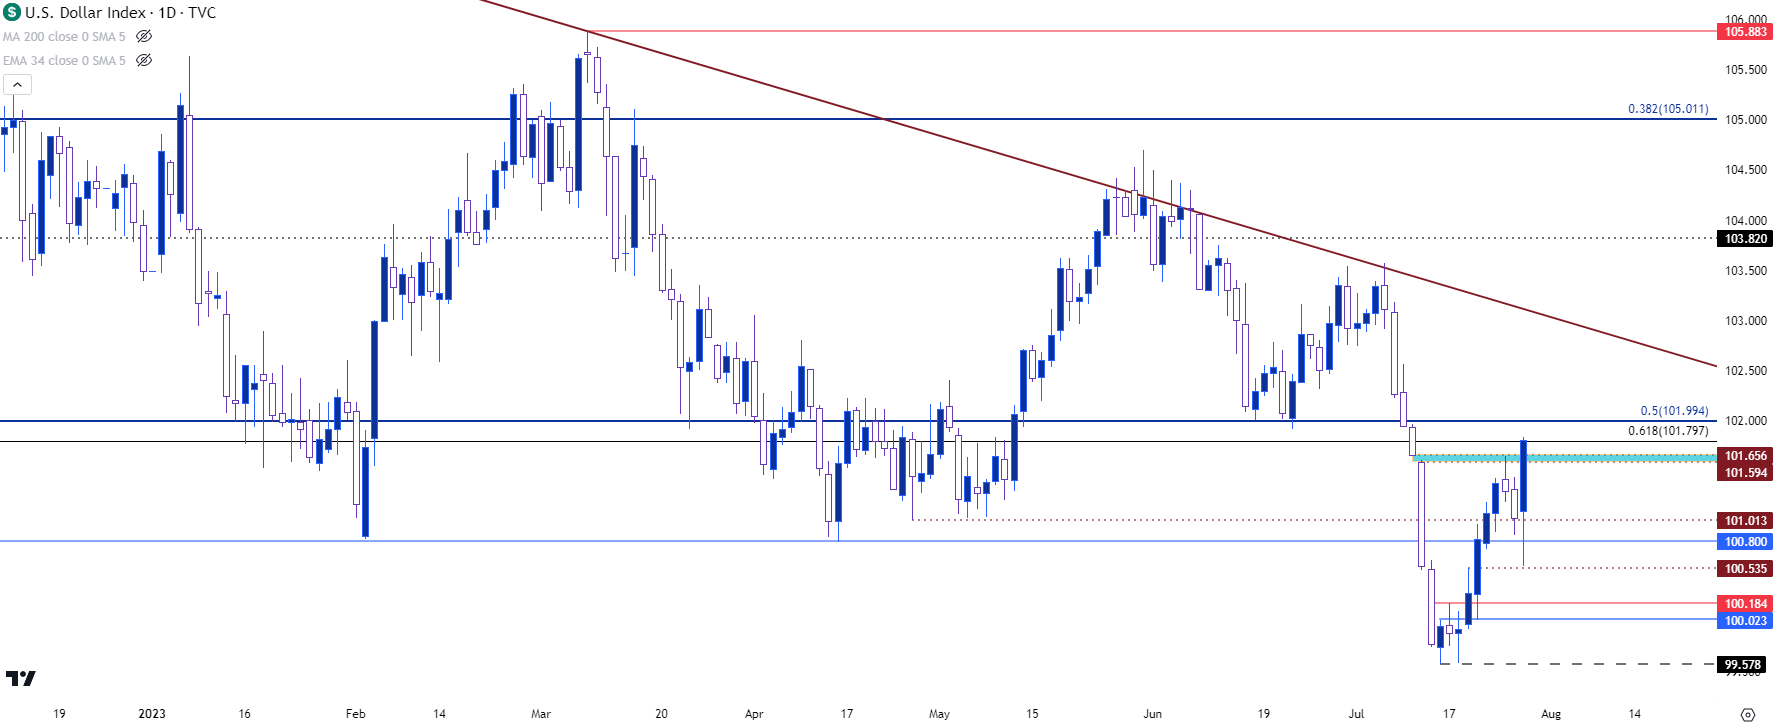 Chart prepared by James Stanley; data derived from Tradingview
US Dollar Longer-Term
Taking a step back to the weekly chart and today’s development brings with it some potential. So far this weekly bar is largely just taking strength from today, so it’s early, but the fact that the DXY is working on its second consecutive weekly gain is notable given that it’s taking place after a breakdown move that, so far, bears have refused to continue.
This puts emphasis on short-term resistance around the 102 handle, as noted above, and if bulls can press beyond that then bullish potential for USD will take on a bit more prominence.
Taking a step back another item of note is a potential falling wedge formation. The key for this, of course, is a continued hold of support. But, this could set the stage for another re-test of the trendline that held resistance so well in May, June and the first part of July until bears eventually took control.
US Dollar - DXY Weekly Price Chart (indicative only, not available on Forex.com platforms)
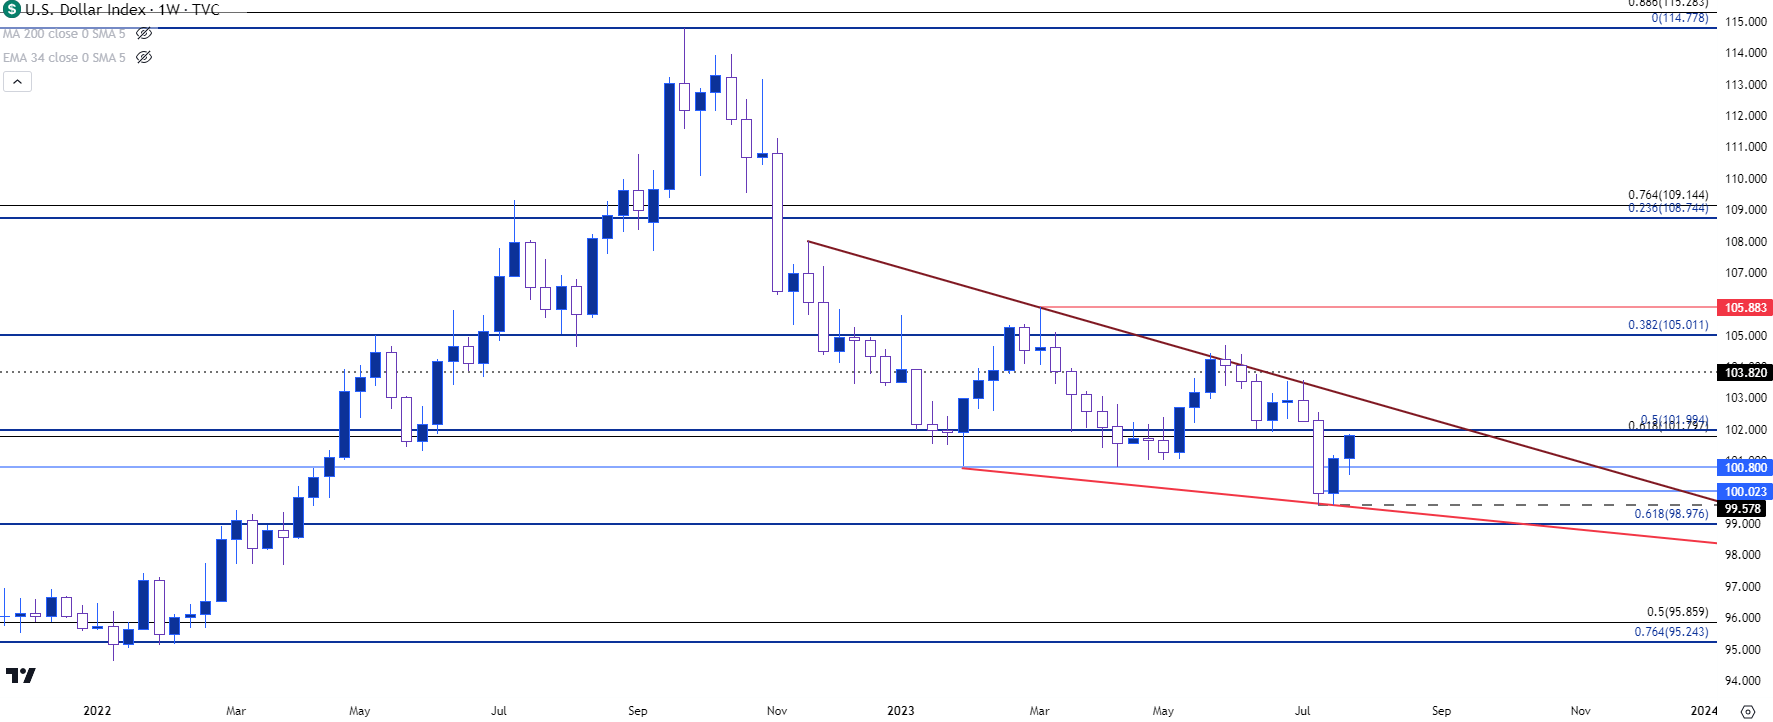 Chart prepared by James Stanley; data derived from Tradingview
EUR/USD
While US data remains relatively strong, the same cannot be said for European data. I had talked about this in the webinar earlier this week and this was something that Christine Lagarde discussed at this morning’s ECB rate decision. And simply, the European Central Bank may not have as much room to raise rates as the Fed given how some data points have already started to take a turn for the worse. Monday brought some very negative PMI prints to the fore, and then Tuesday showed worrisome bank lending data in the survey. Lagarde mentioned that today and this was read by markets as a dovish indication, which showed in the chart during the press conference.
Below, I’ve attempted to parse that out via time in EUR/USD, where the initial bearish punch to the pair showed at 8:15, when the ECB rate statement was released. And even though the ECB hiked, the initial read from bears was that it was a dovish hike and that’s what led to the start of the pullback. There was a hastening in the move at 8:30 AM when US Durable Goods and GDP was released, but the pair didn’t move very far a few minutes after.
It was the ECB press conference that appears to have been the final straw and that’s what helped to trigger the deepest part of the sell-off that, as of this writing, is still going.
EUR/USD One-Minute Chart
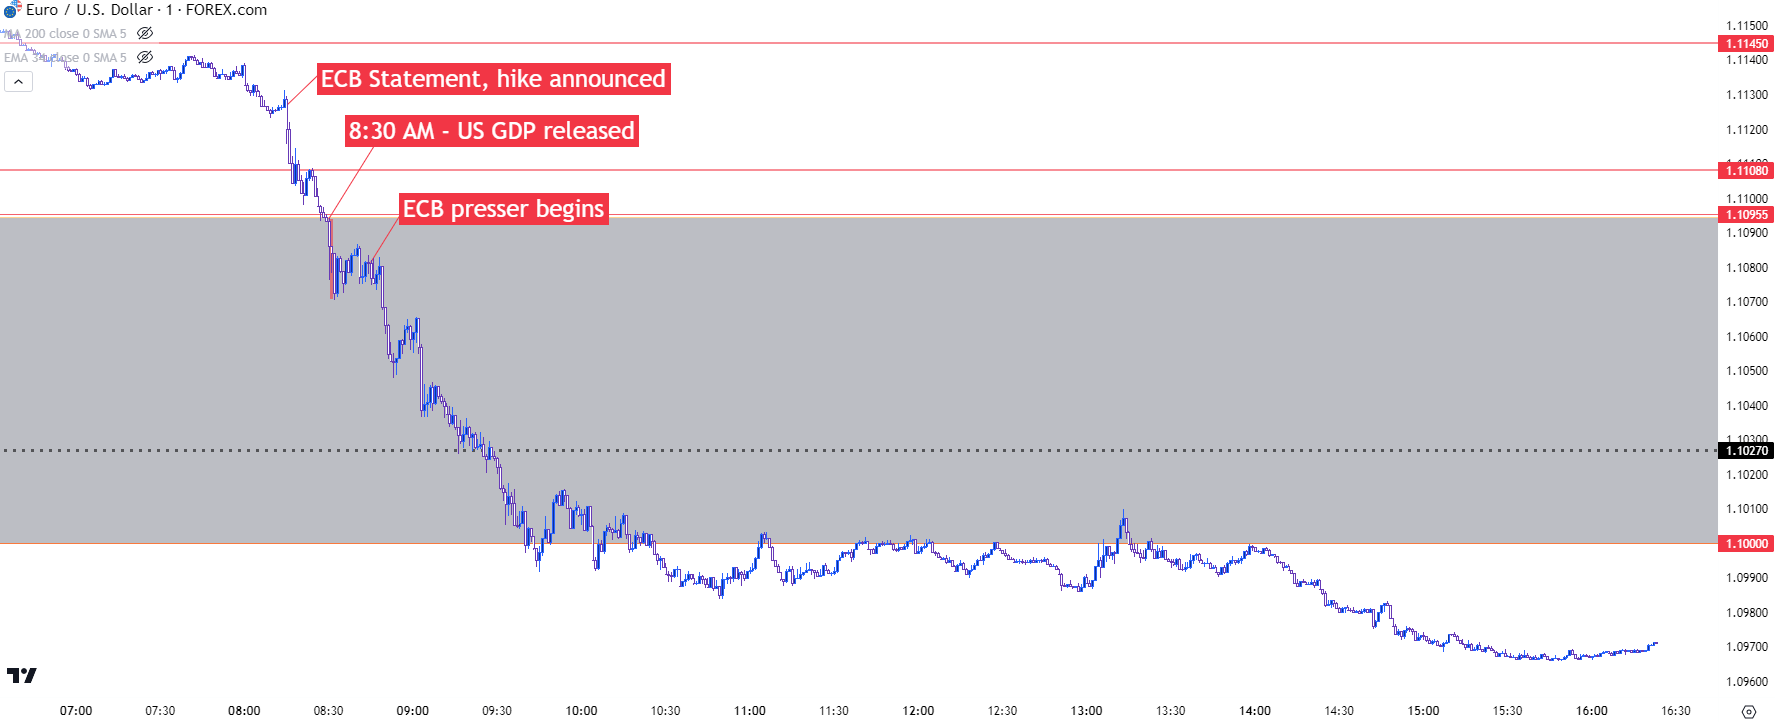 Chart prepared by James Stanley, EUR/USD on Tradingview
EUR/USD Longer-Term
The week isn’t done yet and tomorrow brings another couple of key data points out of Europe with inflation in France and Germany to go along with GDP out of France, Spain, Austria, Germany and Belgium.
And then at 8:30 AM ET, we get the release of US Core PCE which is often called the Fed’s preferred inflation gauge. So, this week is far from over.
The big question is whether bears will get more drive to push fresh lows in EUR/USD and the pair is already very much on its back foot with prices back-below the 1.1000 level. That not only makes the prior breakout after US CPI earlier in July look like a false breakout, but it also begins to give bears the motivation to push a larger-picture shift of trend.
From the daily chart below, we can see a bearish outside bar in EUR/USD pushing towards the next level of support around 1.0943. This is the 50% mark of the same major move that produced the 61.8 retracement that’s so far caught the high. That resistance test was almost perfect with a touch at 1.1275 and bears have been taking more control ever since that inflection.
EUR/USD Daily Price Chart
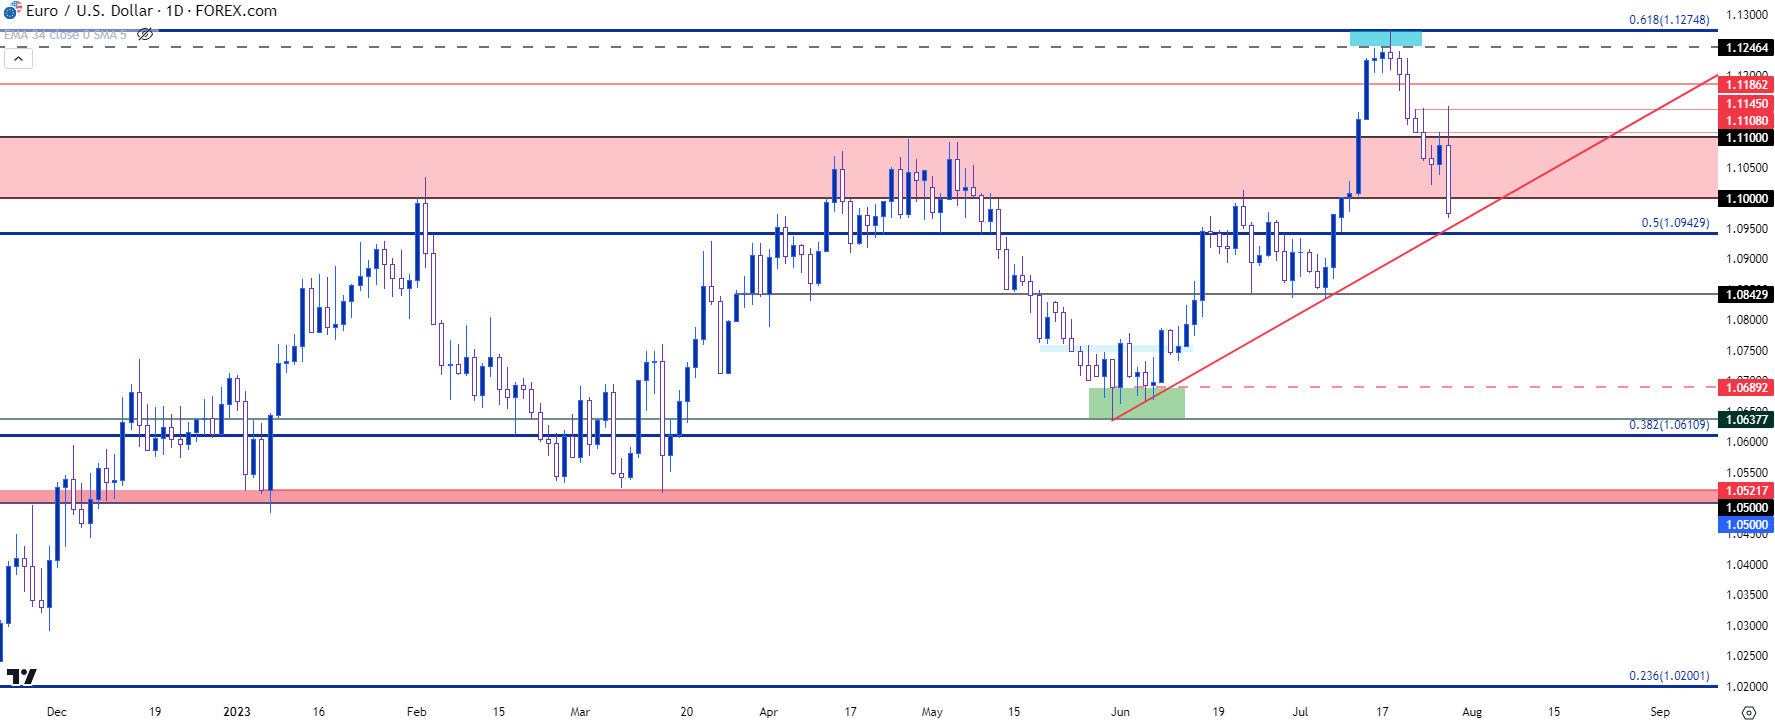 Chart prepared by James Stanley, EUR/USD on Tradingview
Gold
While EUR/USD still has some potential to soften this recent blow given that slate of data on the calendar for tomorrow combined with the size of the bearish move, Gold has a few other issues to deal with at the moment.
Gold has breached the 1949 support level that had previously helped to keep bulls in-control, and this happened after yet another failure from bulls to push the breakout beyond 1981. The daily chart is currently showing as a bearish outside bar, and this puts focus on the next level of support potential around 1936. This as a contentious spot of resistance when price was trying to form a rally off of 1900 support, and it now becomes a spot of interest for support.
The size of the move has been large so a bounce at 1936 doesn’t necessarily rule out bearish continuation scenarios, as a test there would be a lower-low that would keep the door open for lower-high resistance, and that could take place at 1950 or perhaps even 1969.
Key support for Gold would be the 1900 psychological level that held the lows in late-June. If sellers can really push into the end of the week and if 1936 doesn’t put up a fight, 1900 becomes a key spot of consideration.
Gold Futures - Daily Price Chart (indicative only)
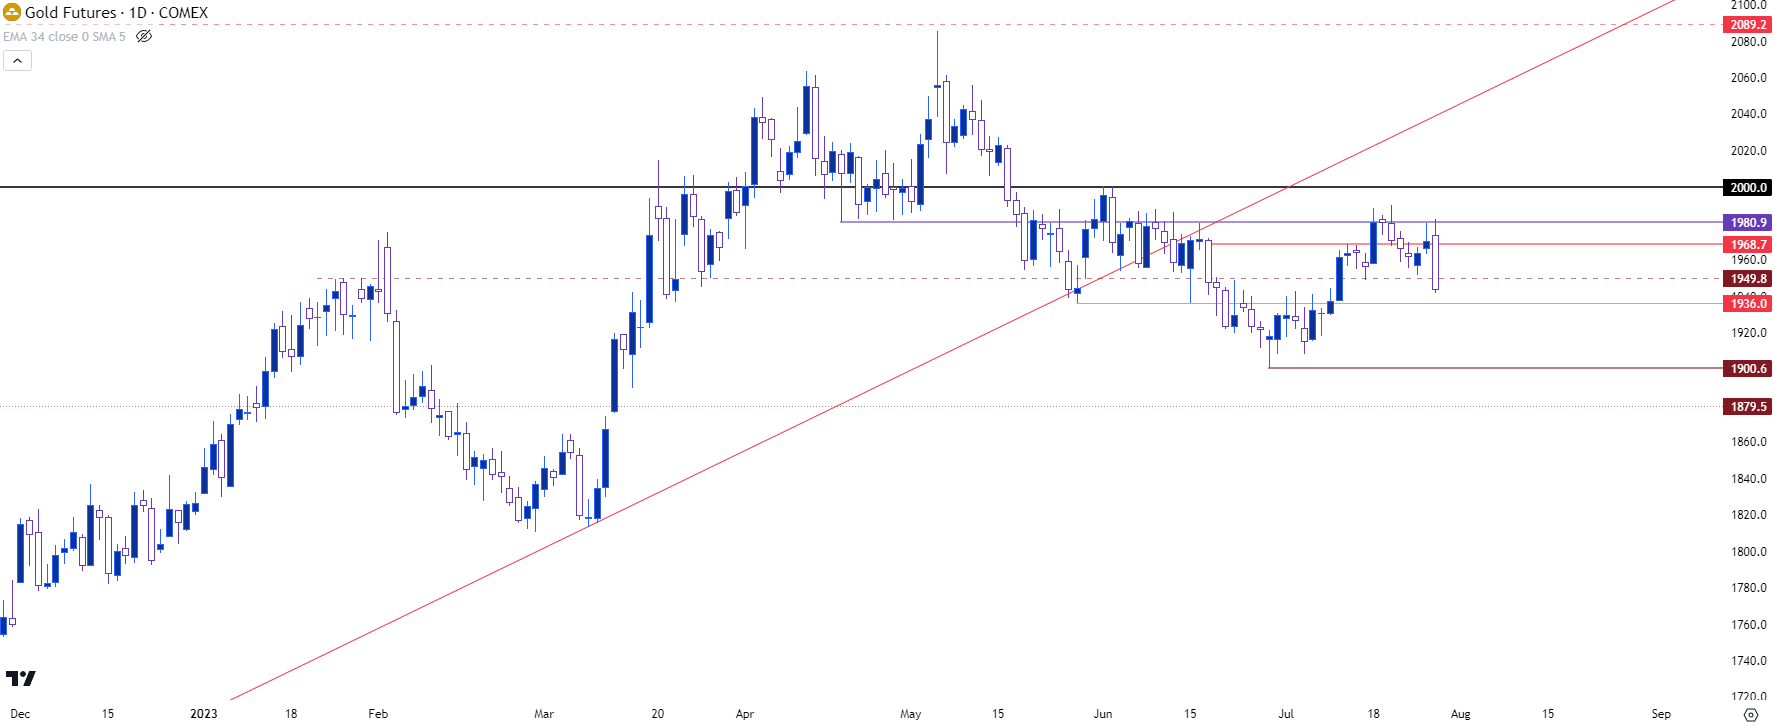
Chart prepared by James Stanley, Gold on Tradingview
--- written by James Stanley, Senior Strategist