GBP/USD Talking Points:
- USD weakness has persisted through Jerome Powell’s second day of testimony and the US Dollar sits just above recently established three-year lows.
- GBP/USD has already broken out to fresh three-year highs, however, and this comes after the morning’s pullback to support at the 1.3594 level looked at in yesterday’s webinar.
- GBP/USD and USD/CAD remain of attraction for USD-weakness scenarios, as looked at in the below video.
GBP/USD has punched up to a fresh three-year high even as the USD sits above its own three-year low. The kitchen sink has been thrown at the Dollar so far this week as Jerome Powell sounded more dovish over the past two days of testimony than he did at last week’s rate decision. And this comes after the week started with a bang as Michelle Bowman said that she was ready to cut rates as early as July, catching many by surprise after a rally had shown in the Dollar coming into this week.
That dovish lean has helped to push USD back down towards lows and U.S. equities back towards highs, as looked at a little earlier today.
While chasing USD-lower while near fresh lows can be challenging, the fact of the matter is that sellers remain in-control and it’s their trend until there’s evidence otherwise. For that USD-weakness backdrop, I remain of the mind that both GBP/USD and USD/CAD are two of the more attractive backdrops for those themes to continue playing out.
In GBP/USD, the pair has traded cleanly with a pullback into this morning with price finding support right at the 1.3594 level looked at in yesterday’s webinar. That price helped to set the low just after the U.S. open, which was followed by a rally and breakout to fresh three-year highs in the pair.
GBP/USD 30-Minute Chart
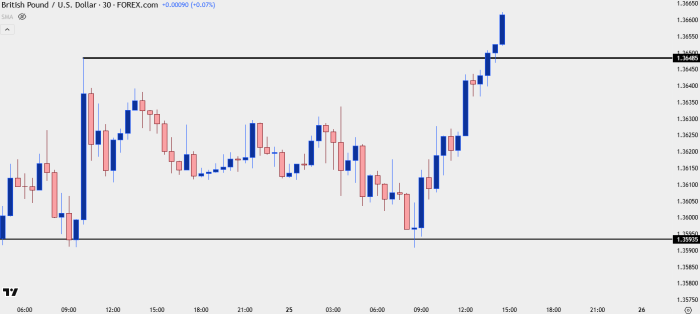
Chart prepared by James Stanley; data derived from Tradingview

GBP/USD Near-Term Strategy
The challenge at this point is that the breakout has already happened, and the fear would be chasing an already-developed move. From the video, I shared a series of levels that can be looked to for short-term pullback potential, with the closes taken from a spot of prior resistance around 1.3639. Below that, another prior resistance swing sits at 1.3629 and then there’s a zone around 1.3611.
You’ll probably notice that all three of these levels are very close to near-term price, and that’s what I would like to see hold to keep the door open for momentum strategies. Below, I’ll take a step back and look at the matter from a longer-term perspective to see how swing traders with longer time horizons might approach the matter.
GBP/USD 30-Minute Chart
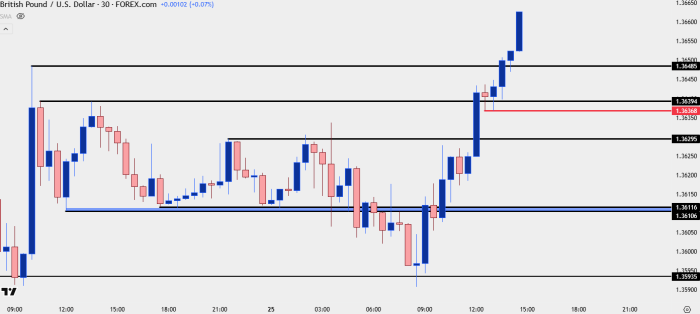
Chart prepared by James Stanley; data derived from Tradingview
GBP/USD Longer-Term
The past three days have been especially bullish in Cable as the 1.3414 support zone led in to a launch of a move that’s now added almost 300 pips to the spot price from the early-week lows.
These are tough moves to chase, but with some scope, we can identify structure that remains key for trend continuation. The 1.3611 zone looked at above is very near a key inflection point taken from the below daily chart around 1.3616. A hold here on a corresponding pullback could be seen as a very bullish item. The key for that would be a hold above the 1.3594 level that set the lows for this morning, showing an element of anticipation from buyers on pullbacks.
If price does sink below that level, then the 1.3500 handle is the next attractive level, in my opinion. The reason for the 94 pip distance would be just how messy the past month has been between 1.3594 and 1.3500, making it difficult to find any clear prices with which we can draw much inference. If 1.3500 is violated, then the look goes back to 1.3414 and a re-test there would need to be met with a higher-low above the Monday swing to keep the door open for bulls.
GBP/USD Daily Price Chart
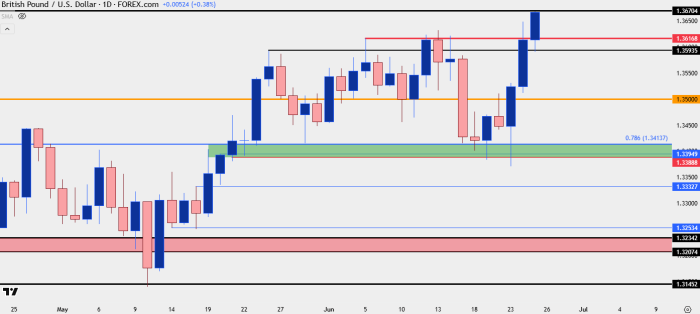
Chart prepared by James Stanley; data derived from Tradingview
--- written by James Stanley, Senior Strategist