
Over the past four trading sessions, GBP/USD has shown a consistently neutral bias, with average fluctuations of around 0.4%, lacking a clear directional move. The recent UK GDP data release has begun to influence the Bank of England’s outlook ahead of its final decision of the year, while expectations for the U.S. Federal Reserve are also shifting. As a result, the pair continues to show persistent indecision, and this neutral tone is likely to remain in the coming sessions as both central banks digest the latest economic data.

Are Rate Cuts Coming for the Bank of England?
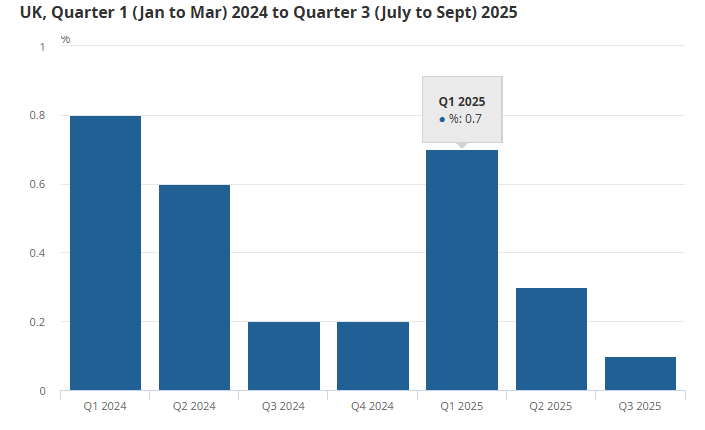
In recent trading hours, the UK’s quarterly GDP data was published, showing 0.1% growth, below the expected 0.2%. More importantly, GDP data throughout the year reveals a steady slowdown in economic activity, a trend that could continue into year-end. The first quarter of 2025 recorded growth of 0.7%, but the latest figure of 0.1% highlights that the UK economy is losing momentum, which could influence the Bank of England’s short-term monetary policy outlook.
Source: Gov.Uk
During its last meeting on November 6, the Bank of England decided to keep its benchmark rate at 4.00% with a neutral stance. However, five members voted to maintain the rate, while four favored a rate cut. The latest GDP figures could shift this neutral stance, as the UK economy appears to be under sustained pressure. This might encourage more committee members to support a rate cut at the next meeting to stimulate economic recovery. While a cut is not guaranteed, the likelihood has increased given the recent data.
In this scenario, a more accommodative policy stance could reduce the appeal of pound-denominated fixed-income assets, creating selling pressure on the pound and potentially maintaining a bearish bias for GBP/USD in the medium term.
What About the Federal Reserve?
Currently, both the Bank of England and the Federal Reserve maintain the same benchmark rate at 4.00%, meaning that the interest rate differential is not a major driver of the pair’s movements in the short term. However, unlike the dovish tilt potentially emerging from the Bank of England, the U.S. outlook appears to be shifting toward caution. The Fed is taking a more neutral stance, as inflation and employment data have not been updated since early October due to the government shutdown, leading markets to anticipate a steady policy decision at the December 10 meeting.
According to the CME Group, the probability of a rate cut to 3.75% currently stands at 53.64%, while the likelihood of holding rates steady has risen to 46.4%. A month ago, the probability of a rate cut exceeded 90%, marking a significant shift in market expectations as the decision date approaches.

Source: CMEGroup
If the Federal Reserve decides to keep rates at 4.00%, while the Bank of England opts to cut rates, this would create a monetary policy divergence that could make U.S. dollar-denominated assets more attractive. Such a scenario would boost demand for the dollar over the pound, potentially generating downward pressure on GBP/USD toward year-end if the trend persists.
GBP/USD Technical Outlook
Source: StoneX, Tradingview
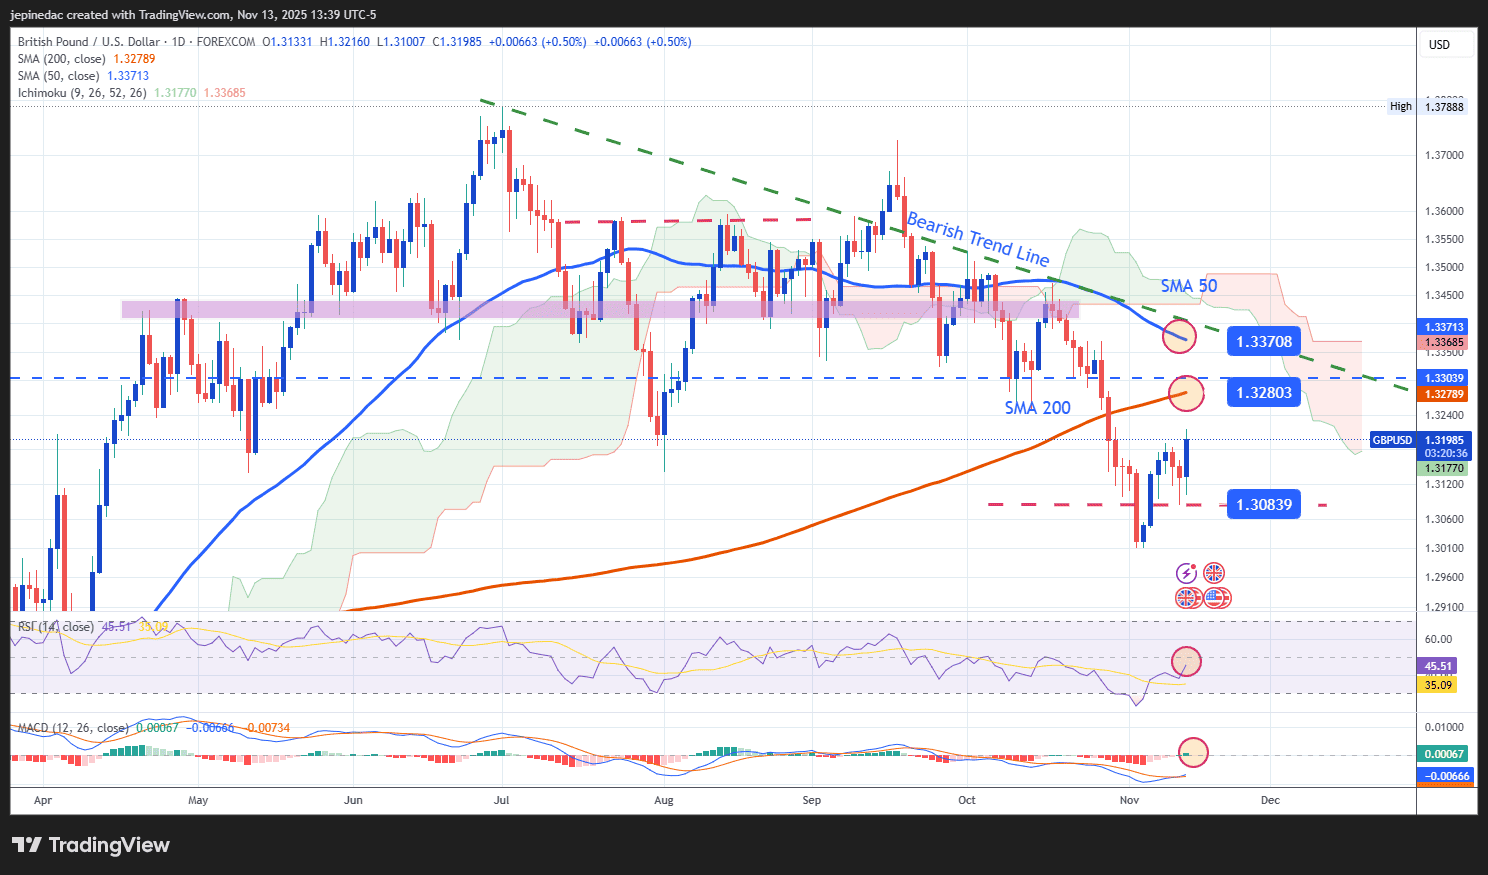
- Downtrend remains intact: Since June 30, GBP/USD has been in a predominantly bearish trend, forming a downward-sloping trendline that continues to define price direction. The 50-period moving average shows a clear downward slope and is steadily approaching the 200-period moving average. If a bearish crossover occurs between these two averages, it could signal stronger selling momentum in the coming weeks, reinforcing the dominant downtrend structure into year-end. Recent bullish corrections have not been strong enough to reverse the overall trend, so the prevailing bias remains bearish as long as the price stays below the key moving averages.
- RSI: The RSI line maintains a slightly upward slope, but it is approaching the neutral 50 level, suggesting a balance between buying and selling forces. This could result in sideways movement and short-term indecision in price action.
- MACD: The MACD histogram shows a similar pattern, fluctuating near the zero line, confirming a neutral bias in short-term momentum. This configuration could extend the lack of clear direction in the sessions ahead.
Key Levels to Watch:
- 1.33708 – Major Resistance: This level coincides with the 50-period moving average and the downtrend line. A breakout above this zone could trigger a technical reversal and a potential shift toward a bullish bias.
- 1.32803 – Nearby Barrier: This level corresponds to the 200-period moving average. A move above this area could sustain a temporary bullish bias, though it would likely be insufficient to break the broader downtrend.
- 1.30839 – Key Support: This marks the most recent low and the primary support zone on the chart. A break below this level could open the door to new lows and reinforce a more aggressive bearish trend in the short term.
Written by Julian Pineda, CFA, CMT – Market Analyst
Follow him on: @julianpineda25