Key Events
- DXY’s stability near 99 continues to pressure major currencies toward key price levels.
- GBPUSD momentum leans to the bearish side as the pair fluctuates around 1.33.
- Flash Manufacturing and Services PMI data on Thursday are expected to inject another wave of volatility across USD, GBP, and EUR pairs.
- The ongoing U.S. government shutdown continues to cast a shadow of uncertainty over financial markets.
Although UK inflation remains sticky at 3.8%, with no Bank of England rate cuts expected in the near term — unlike the Federal Reserve, where markets anticipate cuts this quarter — GBPUSD continues to consolidate with a bearish bias.
The pair remains pressured by a two-year resistance zone, despite breaking out beyond the borders of a contracting formation that has been developing since 2008, as detailed below.
Technical Analysis: Quantifying Uncertainties
GBPUSD Outlook: 3-Day Time Frame – Log Scale
Source: Tradingview
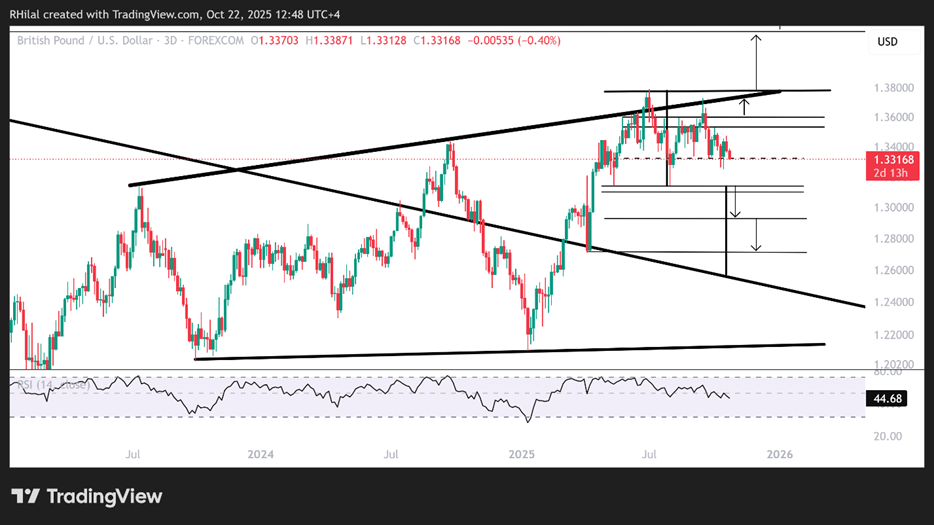
GBPUSD is tracing a sideways consolidation below a well-respected resistance level near 1.3780, in place since July 2023.
Two rejections from that resistance are visible, and a drop below the respective supports at 1.3140 could confirm a potential double-top formation as the RSI leans bearish.
Such a breakdown could extend losses toward 1.2940 and 1.2700, recharging momentum toward the upper boundary of a contracting formation that has been present on the chart since 2008, shown in the next figure.
The 3-day RSI is holding below the neutral 50 level, suggesting that bearish bias remains intact.
On the upside, if prices recover above the recent peaks near 1.3780 and the July 2023–September 2025 trendline, gains could extend above the 1.40 mark, with further resistance near 1.42, aligning with the 2021 highs.
GBPUSD Outlook: Monthly Time Frame – Log Scale
Source: Tradingview
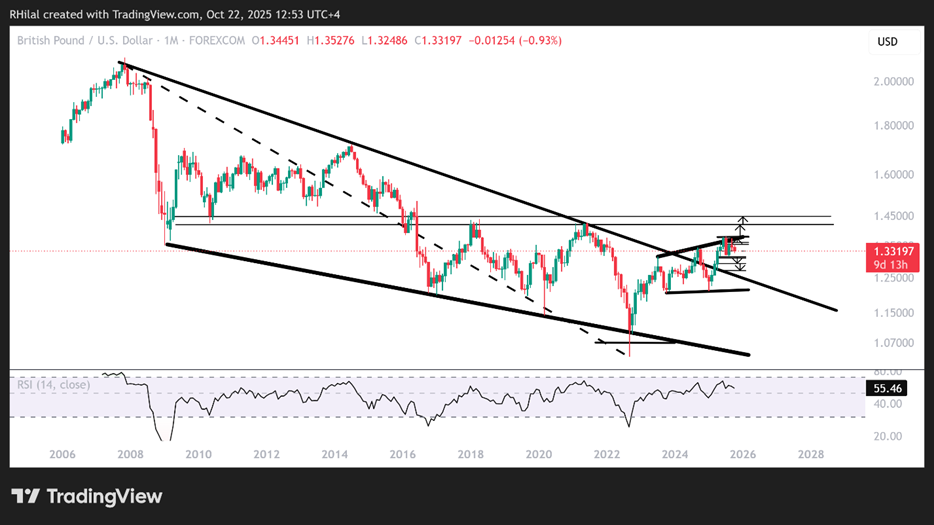
On the monthly chart, GBPUSD is consolidating after a bullish breakout beyond the borders of a contracting price formation connecting consecutive highs and lows since 2008 — marking a notable breakout followed by a possible pullback toward the upper boundary.
The monthly RSI remains near overbought levels last seen in 2021, suggesting a potential pullback scenario to retest the upper boundary near 1.27 and 1.25 in extreme cases before the long-term trend resumes.
Should the pair break higher above 1.38, the bullish bias may persist toward the 2021 peaks, before another corrective phase potentially unfolds.
Written by Razan Hilal, CMT
Follow on X: @Rh_waves