Key Events
- Trump’s latest comments, foreseeing a near-term resolution to the Middle East conflict, re-injected bullish sentiment into markets, lifting Bitcoin toward the 75,000 resistance and gold toward the 5,200 resistance.
- WTI crude oil is winding down after Trump signaled that prices above $100 per barrel may not be sustainable. This has supported positive sentiment, given the implications for global inflation expectations and interest rate decisions.
- US CPI is due Wednesday. The report is unlikely to reflect Middle East conflict risks or carry as much market impact as developments surrounding the Strait of Hormuz.
Intermarket Chain Reaction Still Intact
The broader intermarket chain remains solid. Middle East oil supply risks, from storage facility threats to Strait of Hormuz disruptions, have been lifting crude prices, inflation expectations, and the US Dollar.
However, key markets including the DXY, gold, Bitcoin, and Nasdaq are now challenging major long-term levels that could confirm whether a structural breakout is developing.
Key Levels to Watch
- DXY: 99.50
- Nasdaq: 25,200 – 25,800
- Gold: 5,200
- Bitcoin: 75,000 – 80,000

A sustained break above 99.50 in the dollar would confirm renewed inflation expectations, potentially dampening global risk sentiment and rate-cut expectations.
Meanwhile, a breakout above resistance in gold, Nasdaq, and Bitcoin would reflect dollar weakness and a broader return to risk-on sentiment.
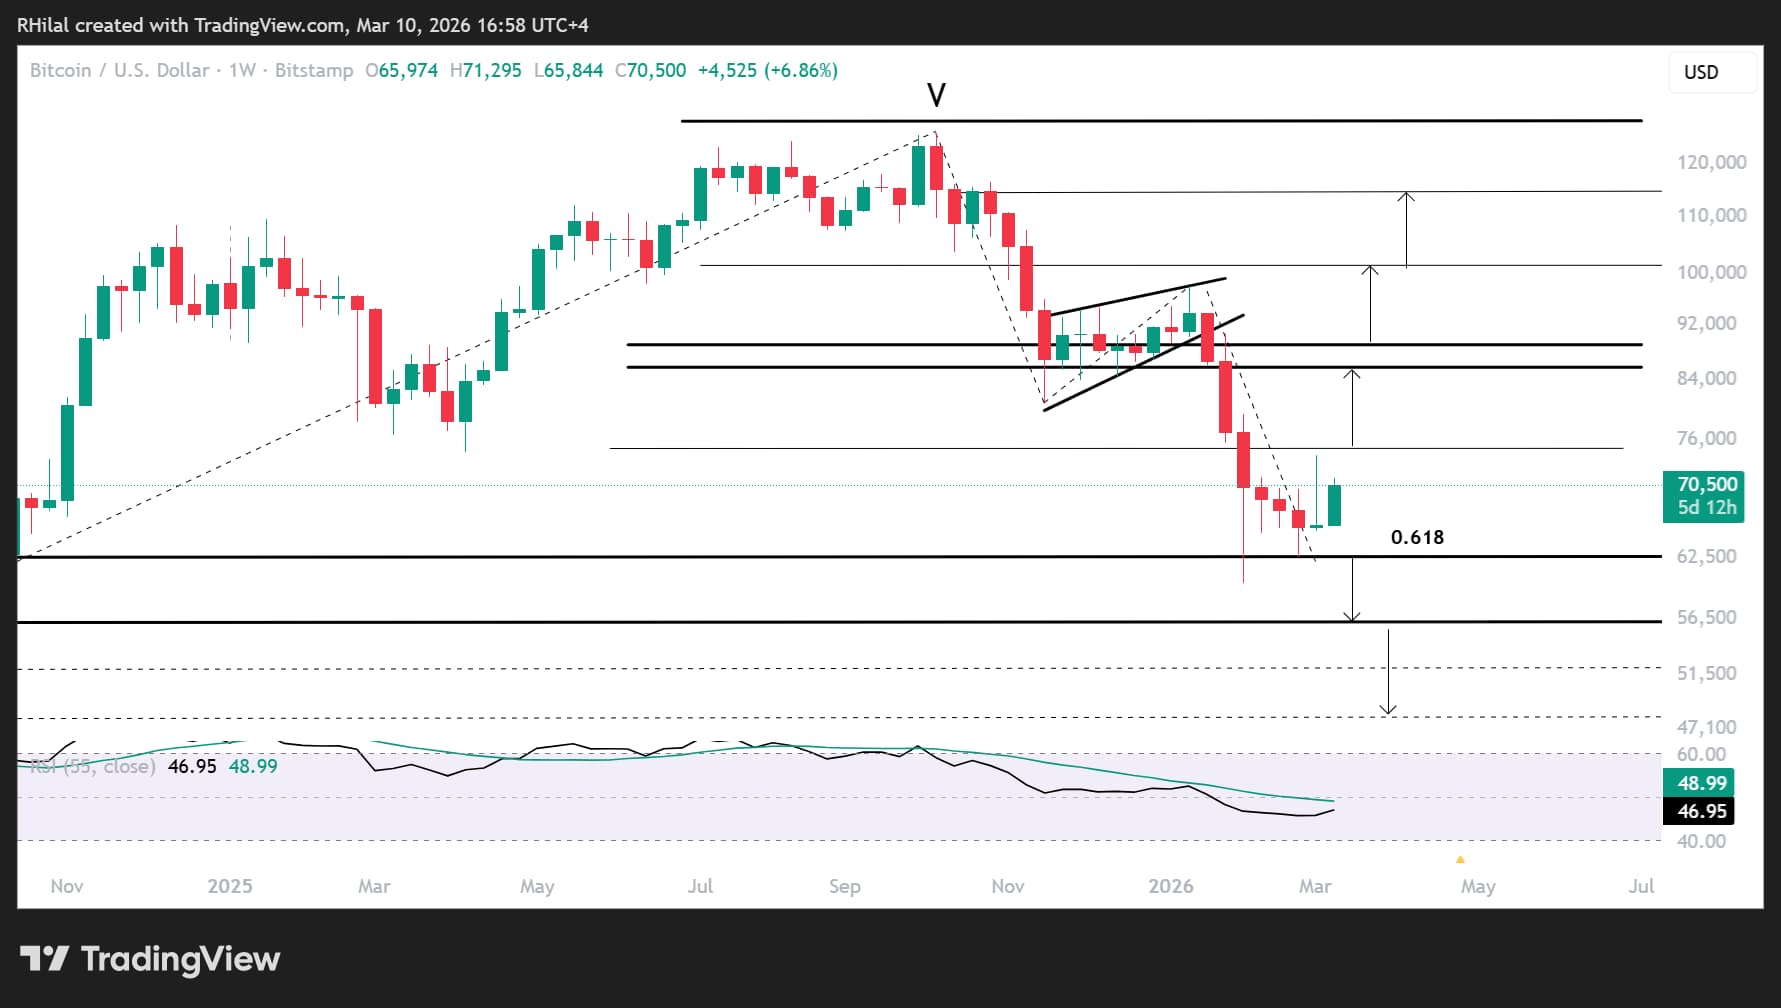
Bitcoin Outlook: Weekly Time Frame – Log Scale
Source: Trading view
Bitcoin’s technical structure remains intact, with price action holding a rebound above the 60,000 support.
The significance of this support lies in its alignment with:
- The 0.618 Fibonacci retracement of the 2022–2025 uptrend
- Former resistance connecting the 2021 highs
- The full measured target of the bearish wedge formed between November 2024 and January 2026
If price action sustains a breakout above the 75,000–80,000 resistance zone, bullish momentum could resume toward 90,000, 100,000, and 130,000, before exposing the 150,000 and 200,000 thresholds, particularly if supported by favorable global regulatory developments.
On the downside, a weekly close below 60,000 exposes 56,000 and 48,000, which may present strategic dip-buying opportunities.
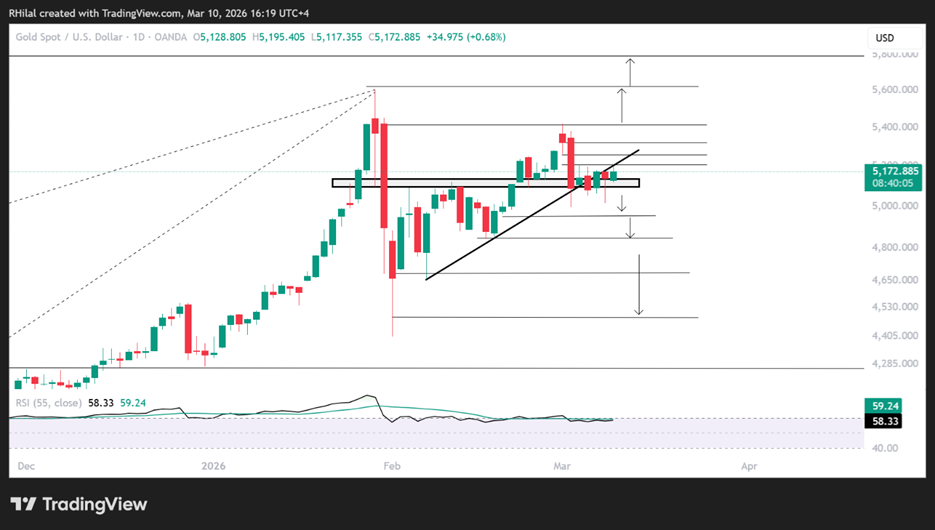
Gold Outlook: Weekly Time Frame – Log Scale
Source: Trading view
Gold remains in consolidation, trading beyond the trendline connecting higher lows since February 2026. The bias leans neutral-to-bearish below the 5,200 resistance and above the 4,960 support.
A weekly close above 5,200 exposes: 5,250 - 5,320 - 5,400 - 5,600 - 6,000
On the downside, a close below 4,960 exposes a deeper correction toward: 4,840 - 4,680 - 4,480
These represent approximately 200-point declines between previously respected support zones. A break below the February 2026 lows could expose a further 1,000-point correction, resetting momentum before realigning the metal with potential new record highs.
Written by Razan Hilal, CMT
Follow on X: @Rh_waves