Gold prices broke out from a symmetrical triangle last week after US Treasury Secretary Scott Bessent said that Kevin Hassett was the frontrunner for the FOMC Chair position. That rally has since continued and with the Fed expected to cut next week along with another 50-75 bps in cuts next year, the same driver that’s been pushing the metal for the past two years remains in full force.

It was the February CPI report last year that I think was the major tell. CPI in the US remained hot and there was real questions as to whether the Fed would be able to cut rates later in the year. On February 13th, another strong CPI print was released and gold put in its first daily close below the $2k handle in 2024. Notably, that psychological level was a major spot of resistance for the three-and-a-half years prior as it contained rallies on multiple occasions. But as the Fed opened the door to cuts in December of 2023, gold meandered above that price, albeit unconvincingly, and for the first six weeks of 2024 trade that level had come in to hold as support.
The CPI print in February changed that though, as expectations were quickly dashed about any impending rate cuts. That lasted for about a day, and on the 14th, Chicago Fed President Austan Goolsbee said in a television interview that markets should avoid getting ‘flipped out’ about a single inflation print, even if it wasn’t just a single print. A day later gold rallied above $2k and didn’t look back, and those two days were the only daily closes in spot gold below the big figure for last year.
Now – it’s the $4k level that’s been in as recent support and buyers have shown no sign yet of letting up.
Gold Monthly Chart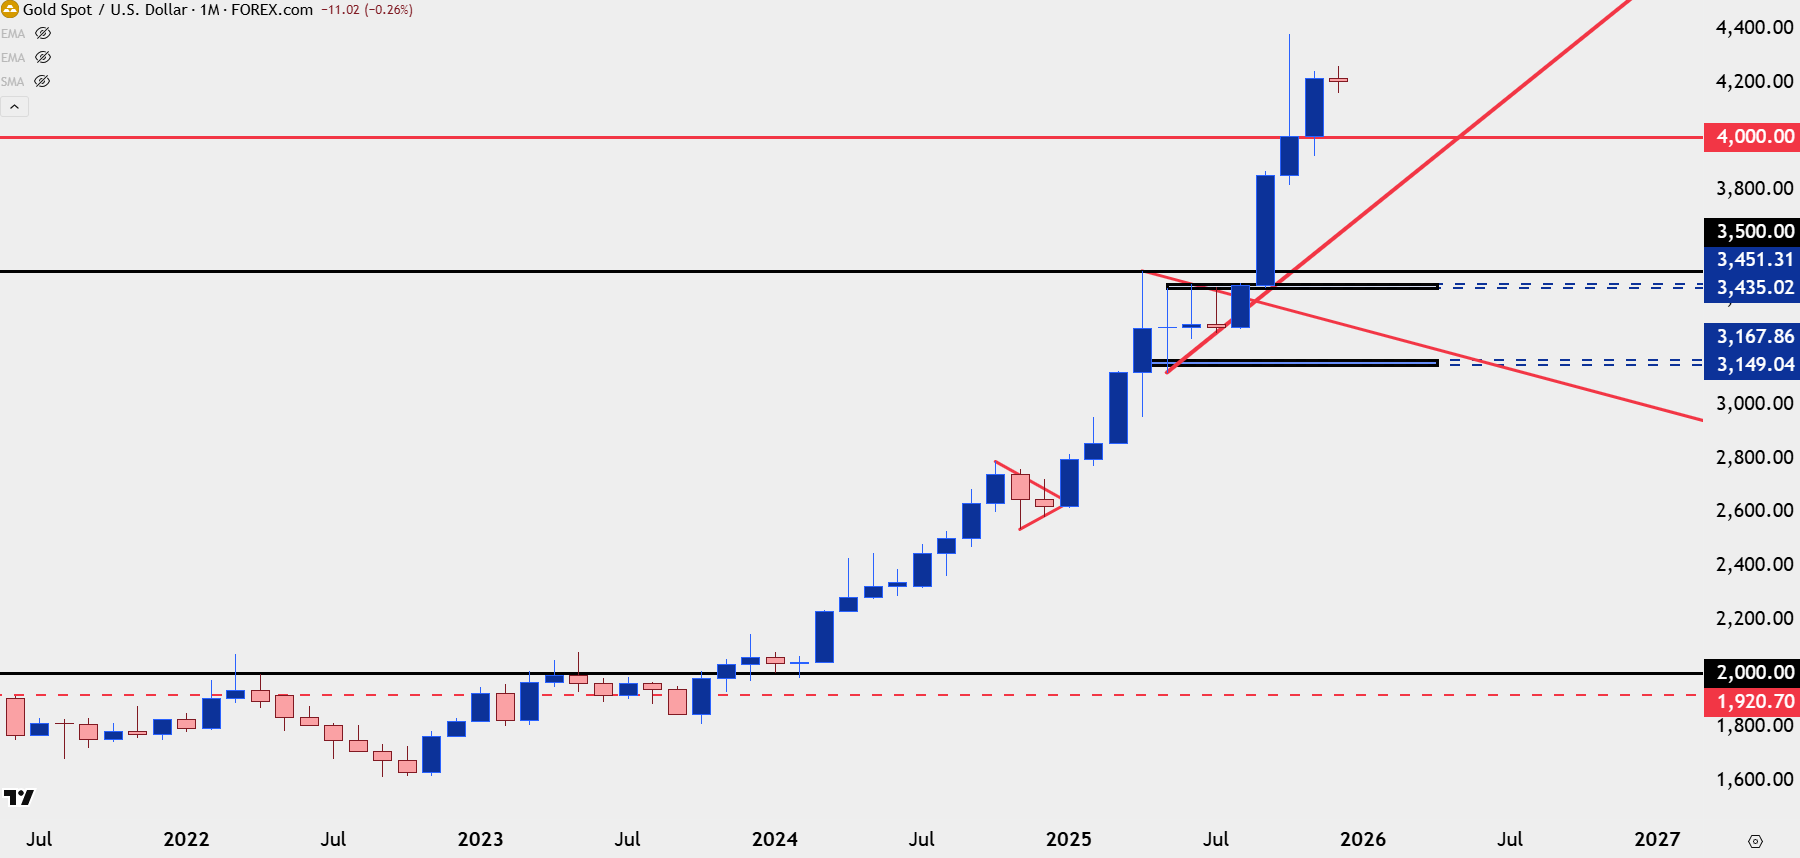
Chart prepared by James Stanley; data derived from Tradingview
Gold Consolidation
A two-year trend isn’t the most usual thing away from the equities space, but given the push in monetary policy that we’ve had, with a Federal Reserve cutting rates even as inflation remains high, there’s been a strong drumbeat from longs that have kept the rally going. It hasn’t been linear though, and interestingly, this illustrates the power of positioning even when a fundamental bias largely remains intact. To be sure, there has been fundamental motivation for the consolidation periods in gold, which we’ve now seen on three separate occasions.
In the final two months of last year, Treausry rates were running and the USD was rallying as inflation picked up after the Fed started cutting rates. This stalled gold prices for the final two months of the year although there’s also the Bitcoin explanation, which is when BTC/USD jumped after the election of President Trump; almost as if there was another candidate for non-fiat flows taking over. But shortly after BTC ramped above 100k, gold broke out, and ran aggressively in early-2025 trade until the metal finally tagged the $3500 area.
After a rally of that magnitude there’ll often be considerable profit taking, and this can lead to lower-highs as bulls get more and more willing to shed exposure as bounces look weaker and weaker. But – if that’s also being met with fresh buyers coming in at higher-lows, we have a symmetrical triangle formation, and when that’s meshed up with a prior bullish trend – a bull pennant formation.
That’s what showed in the final two months of last year and then that’s what showed in April, right around the time that equity strength took back over following President Trump taking a step back on tariff implementation.
In that episode, with stocks rallying and economic conditions improving the prospect of more rate cuts later in the year became more difficult to justify. But it was Powell’s speech at Jackson Hole when he finally sounded ready to reduce rates and that’s what led to the breakout from the second bull pennant, and that drove gold prices even beyond the $4k level.
The market was incredibly one-sided during that parabolic run and as gold began to stall, profit taking took over. But – notably – there was not a single weekly close in spot gold below the $4k level, as evidence that buyers were using the dip to add or establish fresh exposure. And there was also the familiar chorus of higher-lows, helping to build another symmetrical triangle that made up bull pennant #3.
Gold Weekly Chart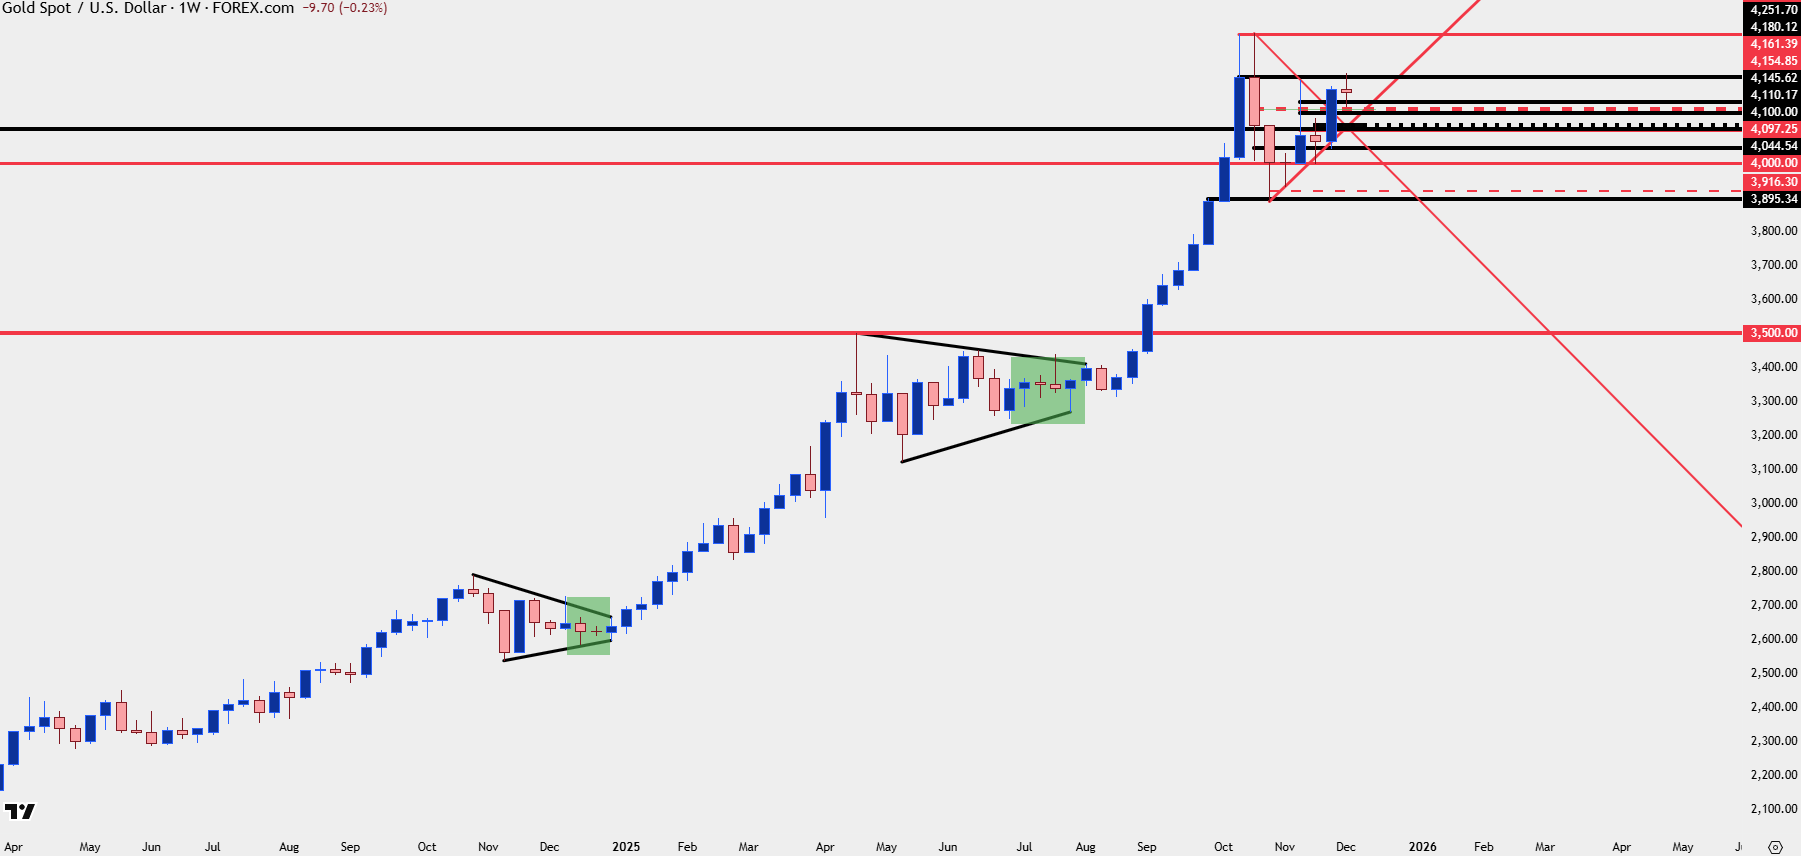
Chart prepared by James Stanley; data derived from Tradingview
Gold Bull Pennant Breakout #3
What seemed to push the recent rally out of digestion was last week’s news that Kevin Hassett, current Director of the National Economic Council, is the frontrunner for the next Fed Chair nomination. The wide expectation is that he’s heavily dovish, and that he’ll cut rates as President Trump has been wanting. And as such, rates markets are currently pricing in another 50-75 bps in cuts for next year, even after a cut in December. And considering that the inflation data that we did see before the government shutdown was around 3%, that makes for a similar backdrop as what we saw all the way back in February of last year.
The initial breakout from last Friday extended into Monday, with a familiar level of 4250 coming in to set the high. That so far has led to a pullback and defense of a support level as taken from prior resistance of 4154-4161.
But that 4250 level doesn’t look ready to yield yet, although next week’s Fed meeting may be an important driver on the matter.
Gold Daily Chart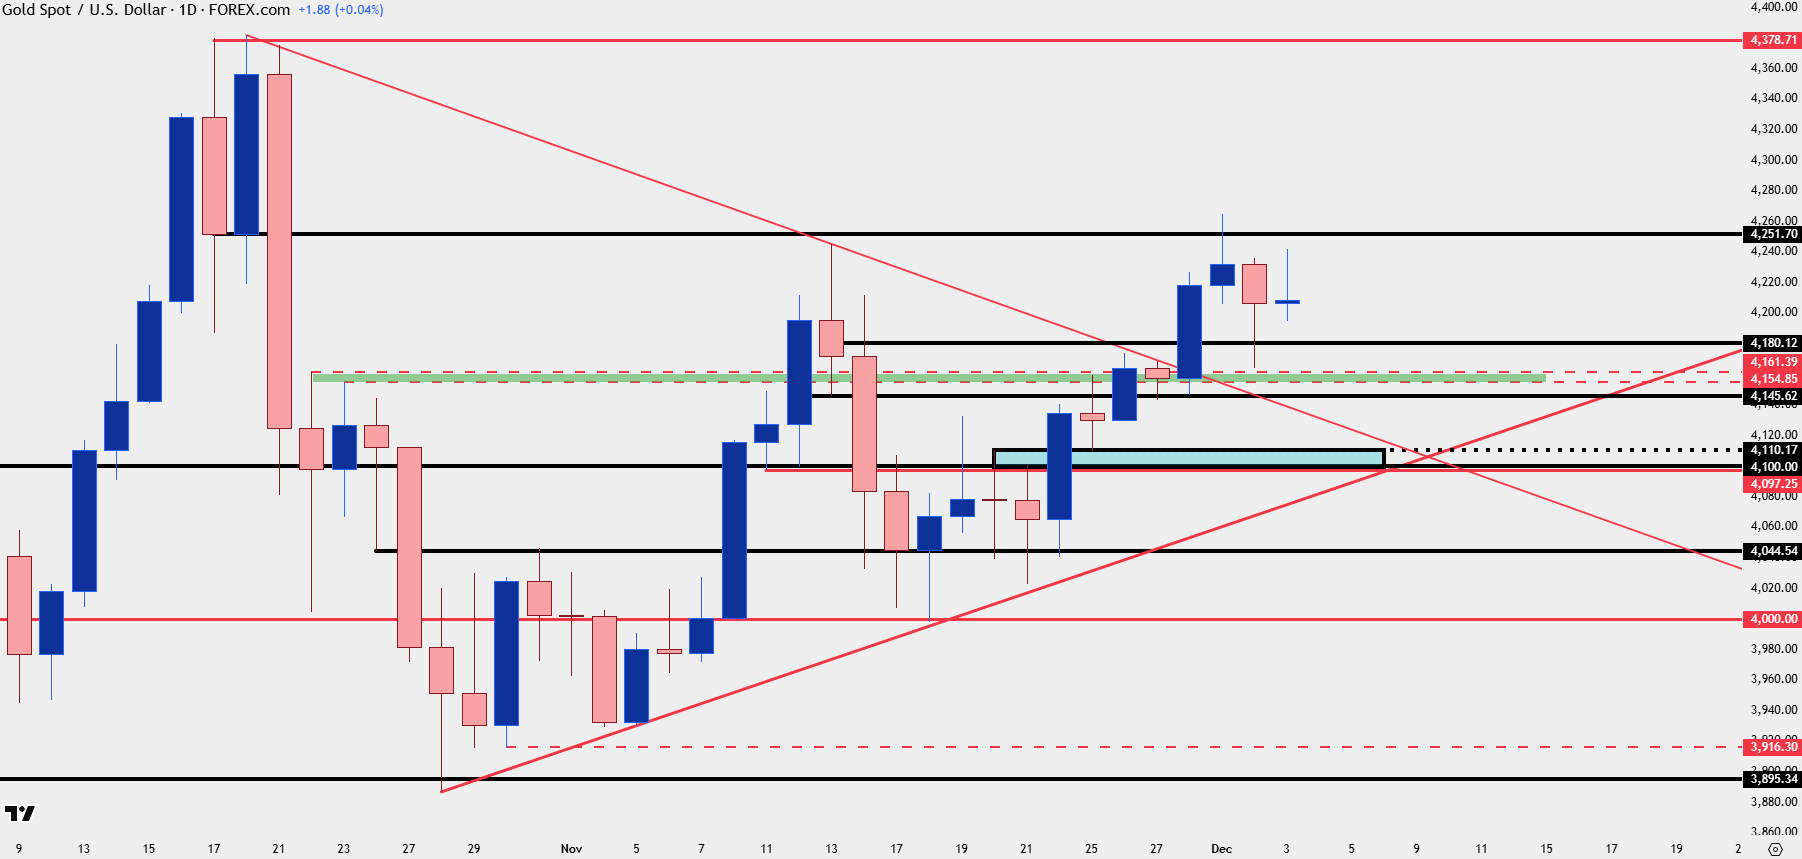
Chart prepared by James Stanley; data derived from Tradingview
Gold Four-Hour
The four-hour chart is important here as we’ve seen a lacking willingness from bulls to press into another 4250 test even with a weak USD and a strong support reaction in gold. This suggests that chasing could be problematic but there is a spot for higher-low support as taken from the 4180 level. If that doesn’t hold, 4145 could be an area to look for capitulation lows, although I would want to see a wide underside wick indicating a strong reaction from buyers to make that claim.
And if that doesn’t hold, it’s the 4100 zone of resistance-turned-support that’s next in view. If bulls can’t retain control above that, this breakout will begin looking like a failure and it’ll be time to reassess.
Gold Four-Hour Chart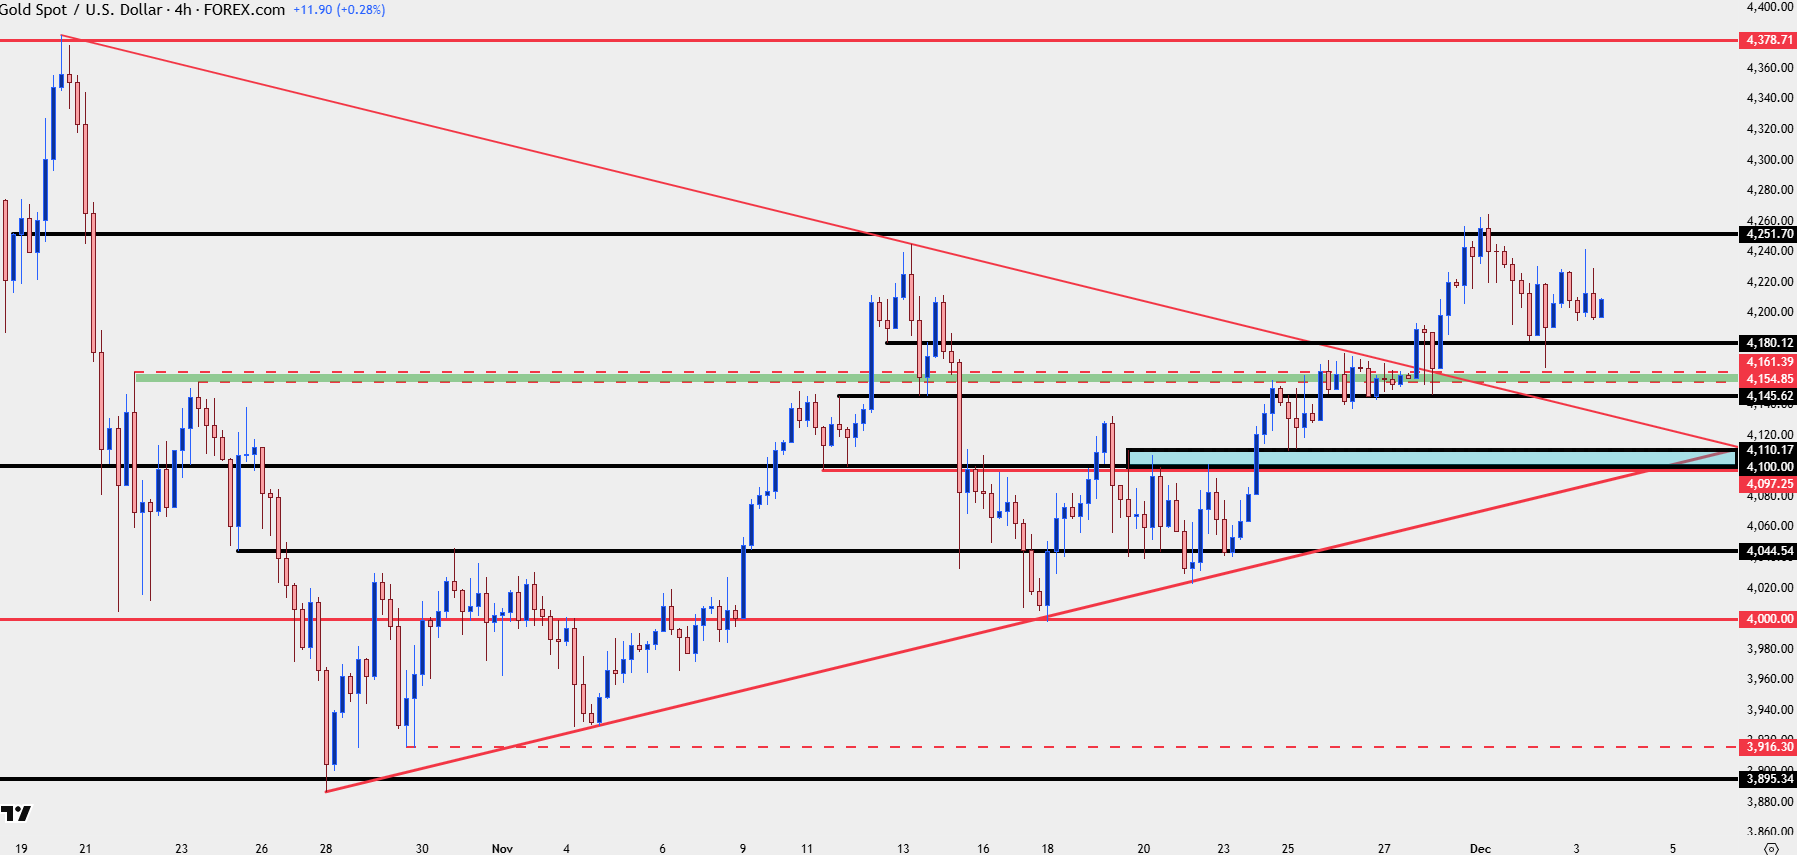
Chart prepared by James Stanley; data derived from Tradingview
--- written by James Stanley, Senior Market Analyst, Global Macro