Gold has been consolidating since the double top broke down in mid-October, but the triangle formation produced by that consolidation has now given way as buyers have continued to press following the support test at the $4k handle two weeks ago. Prior consolidation periods lasted two months to finish last year and then for four months this year, and this one has been shorter so far. The Fed’ rate decision in December will likely have significant sway over the matter and the bank enters their blackout period tomorrow.

The pullback in gold was loud and the metal even pushed below the $4k handle, but sellers couldn’t get far below the 3895 level of prior resistance and that led to a steady build of higher-lows over a three week period that saw a clean test of the $4,000/oz level just two weeks ago.
I looked at that in the webinar at the time, and as I shared then, the appearance of consolidation had already taken hold. There is even some similarity to prior periods of consolidation in gold, as we had a two-month period to finish last year and then a four month outlay earlier this year, with gold finally breaking out on Jerome Powell’s speech at the Jackson Hole Economic Symposium.
Interestingly, the most recent FOMC meeting has appeared to help the matter in gold as the current low was set just a day before that rate cut announcement. And while many other markets have recoiled after Powell refused to commit to a December rate cut, gold has steadily gained with continued bullish price action that’s quite visible on the four-hour chart below.
Gold Four-Hour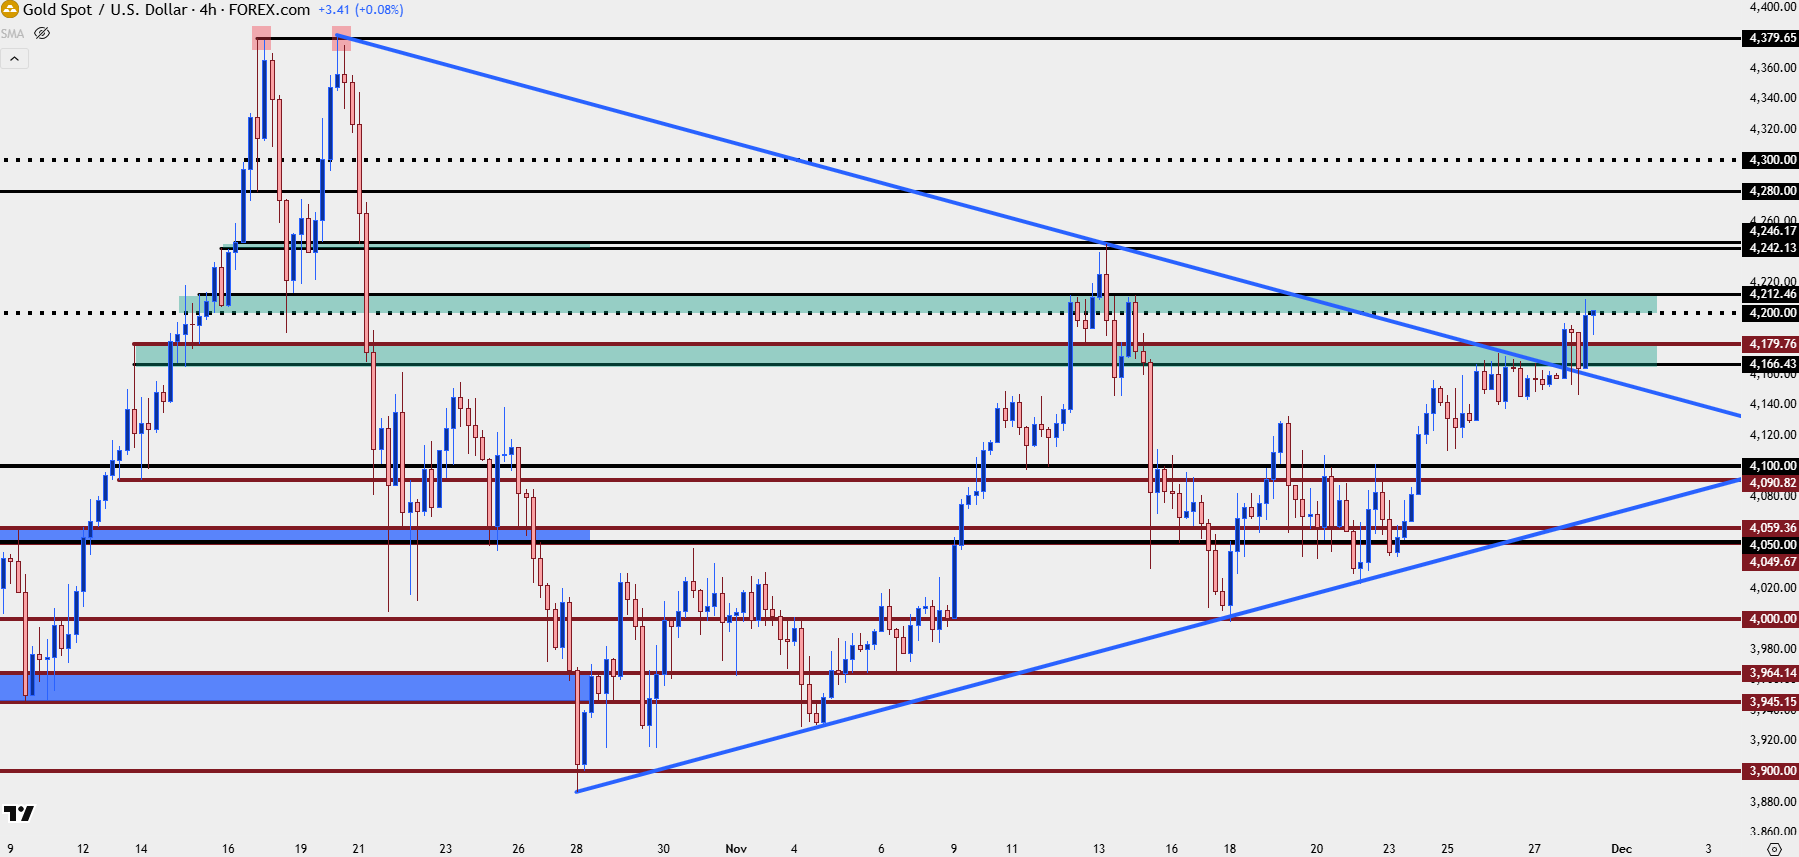
Chart prepared by James Stanley; data derived from Tradingview
It’s the bigger picture around gold that makes this so interesting, as the metal came into 2024 trying to hold support above the $2k handle and less than two years later, it’s the psychological level 100% away from that price that’s providing support today.
But, perhaps more attractively it’s the way that trend has built, as the prior consolidation held as bull pennant formations both last year and this summer.
We’ve had another symmetrical triangle form with the recent bout of consolidation, and this can, again, be looked at as a bull pennant. I’ve been discussing this on webinars of late but this can allow for a directional bias with an otherwise non-directional formation of the symmetrical triangle.
Gold Weekly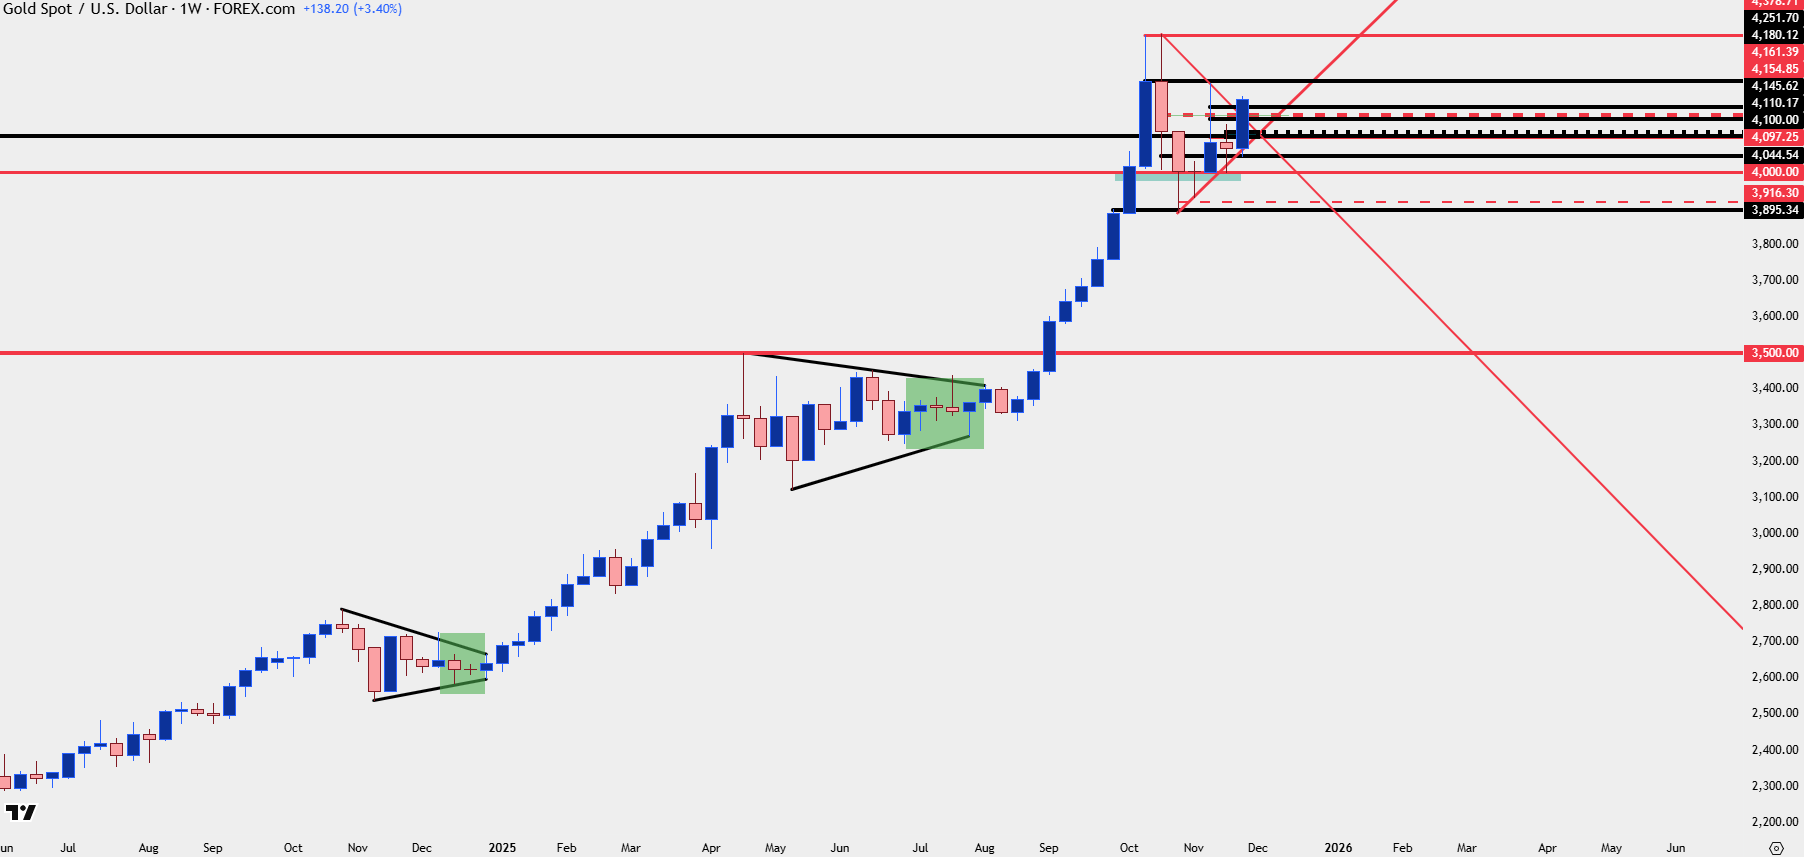
Chart prepared by James Stanley; data derived from Tradingview
Gold Daily
Today is the first day of testing outside of that symmetrical triangle formation so the current breakout is still fresh. But, there’s remaining bullish structure that can be worked with, as there was a prior point of resistance from 4154-4161 that’s now set up for support potential. Below that, it’s the 4100 level that set resistance last week and hasn’t yet been re-tested for support. And below that, the 4044 level that I’ve been tracking showed support for five of six days, with higher-lows leading into the current rally and breakout setup.
Gold Daily Chart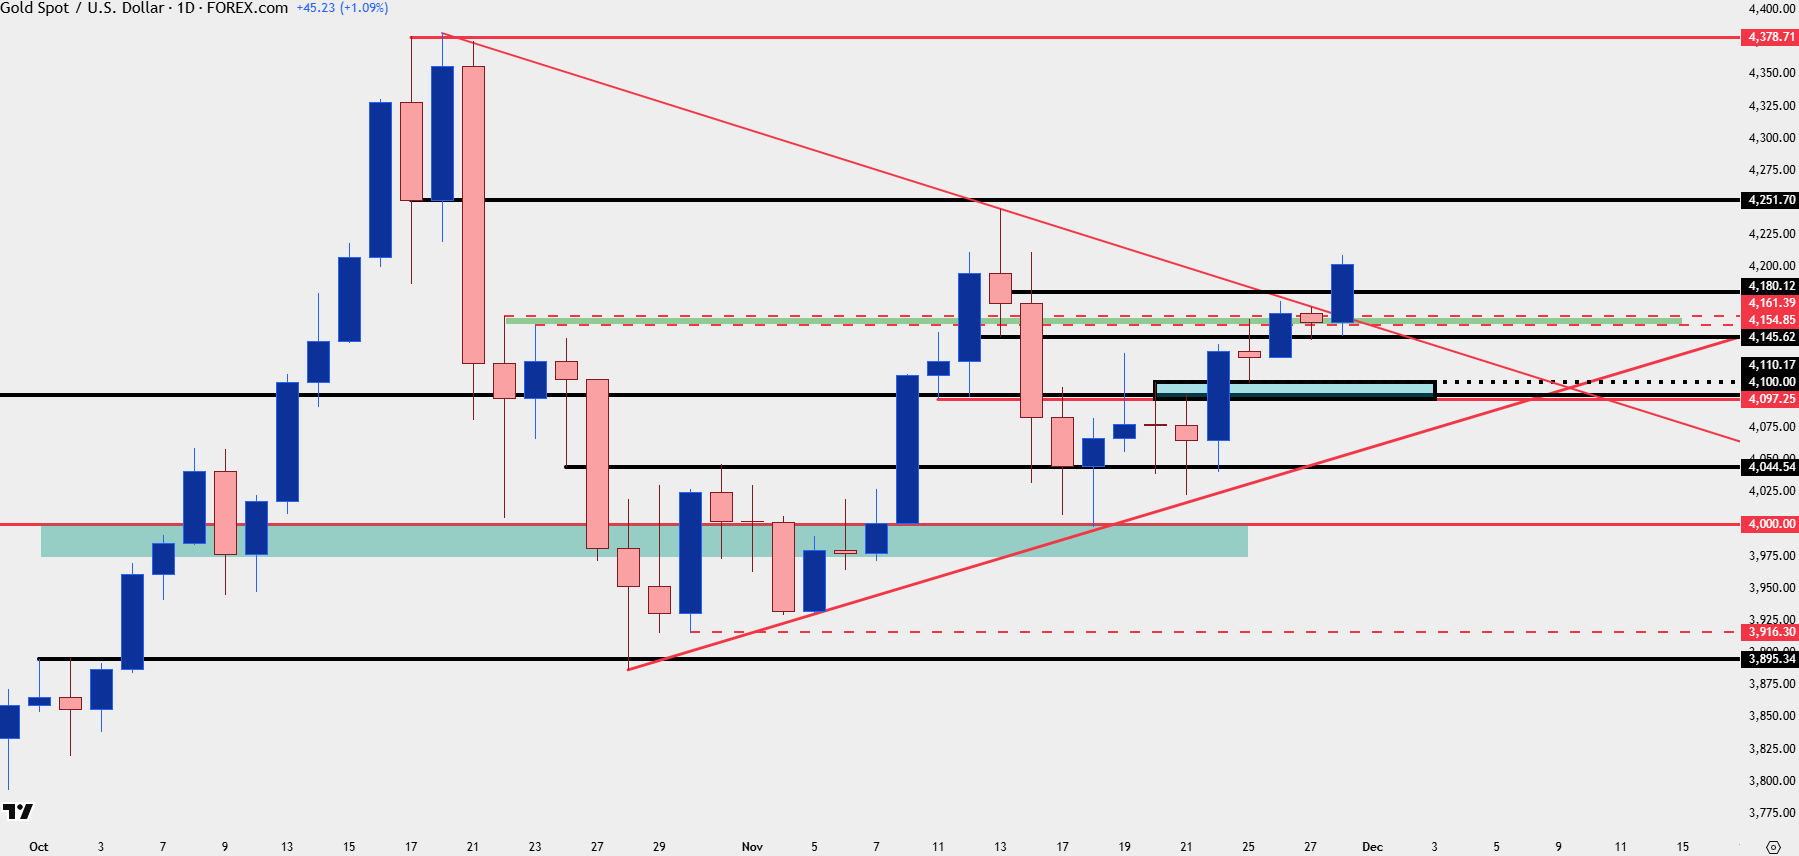
Chart prepared by James Stanley; data derived from Tradingview
--- written by James Stanley, Senior Market Analyst, Global Macro