Gold prices continued to consolidate this week but perhaps the more notable item is the steady build of higher-lows, and the respect of trendline support following the $4k support hit on Tuesday. It was now a month ago that the double top in gold broke down, but prior periods of consolidation lasted for two months last year and then four months earlier this year (into the Jackson Hole Economic Symposium), so it may take some time for buyers to push trend continuation in a meaningful way.

Gold Holds Support at Key Spots
It’s consolidation big picture as we now have a symmetrical triangle pricing in, not too dissimilar from what showed earlier in the year from April through August, and then last year from late-October through the end of the year. In both cases, bullish resolution pushed topside breakouts and at this point, there’s a reasonable argument for something similar as markets are still clinging to the expectation that the Fed will cut rates next year, and perhaps even in December.
On the data front, however, there’s more opacity and that’s likely playing a role here. The US Government shutdown slowed the release of inflation data and that’s what markets want to see to build those expectations for FOMC cuts, which, in turn, can prod the trend in gold.
Nonetheless, buyers have held on well considering the Tuesday support test at the $4k level, which was confluent with the trendline derived from the higher-lows in October and November, and another higher-low showed in early-Friday trade.
Gold Four-Hour Chart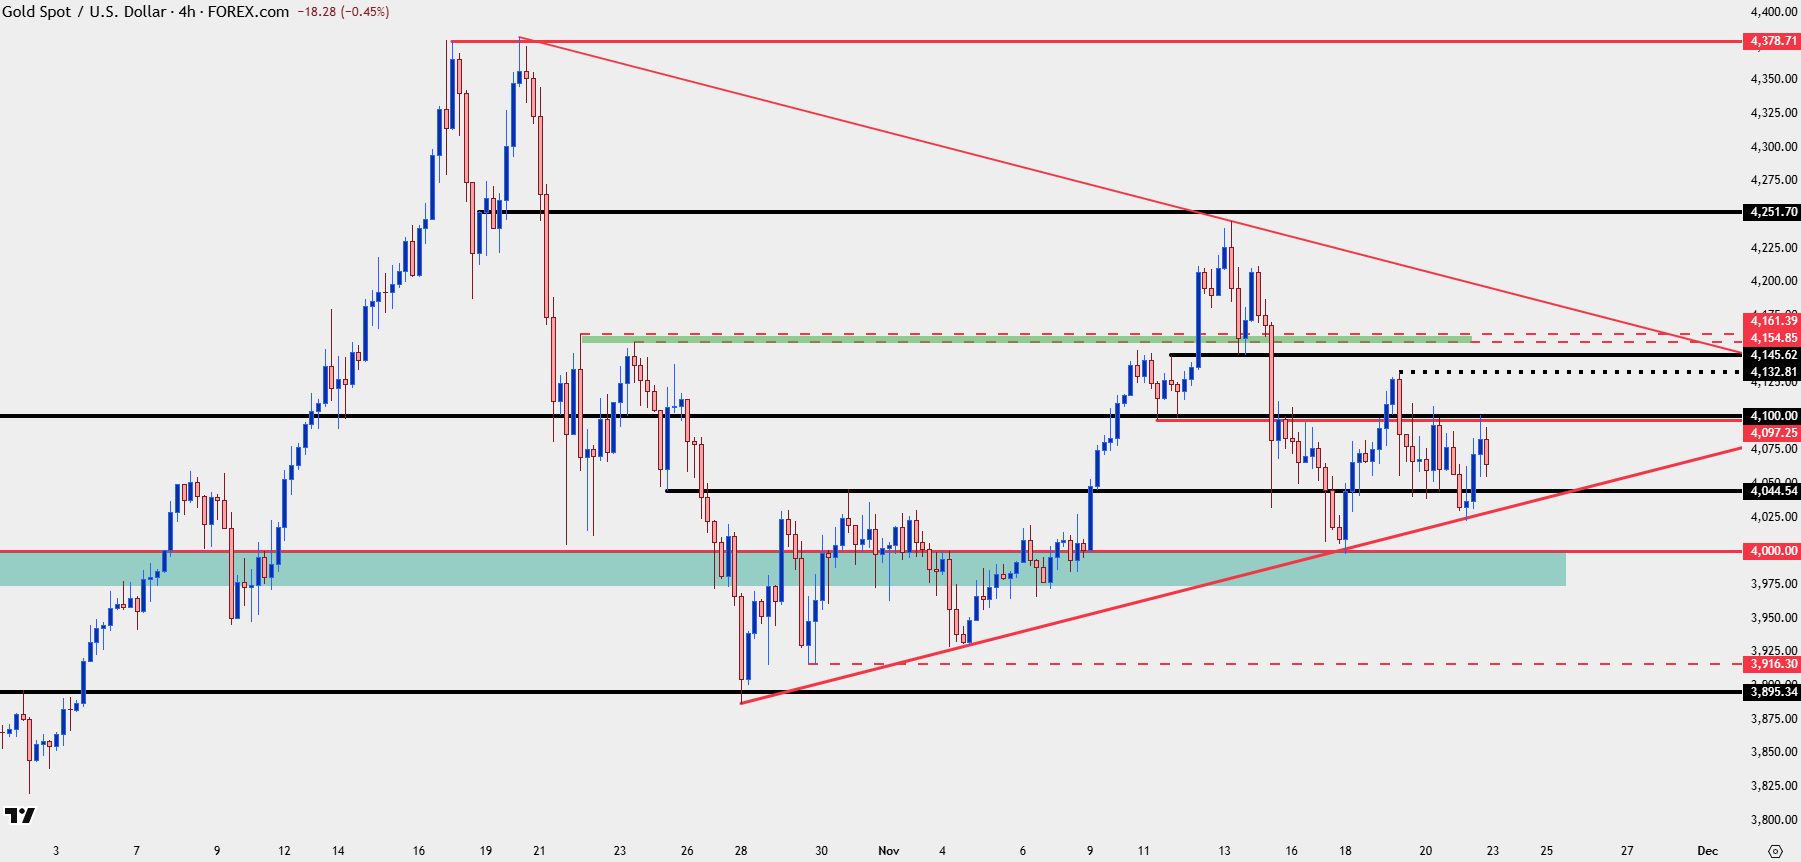
Chart prepared by James Stanley; data derived from Tradingview
Gold Big Picture
From the weekly chart, that consolidation looks a bit more obvious, and it also compares well with prior periods of similar performance when gold price action coiled into a tighter and tighter triangle, until eventually, bulls were able to break free.
Notably, last week printed as an inside bar and that $4k support hold was a key element of that.
The broader picture of continued consolidation does however make it difficult to push aggressiveness for breakouts or even extended trends pushing up to higher-highs as we’ve seen over the past couple of weeks. But, for now, re-tests of higher-lows can remain attractive for bullish sequencing.
Gold Weekly Price Chart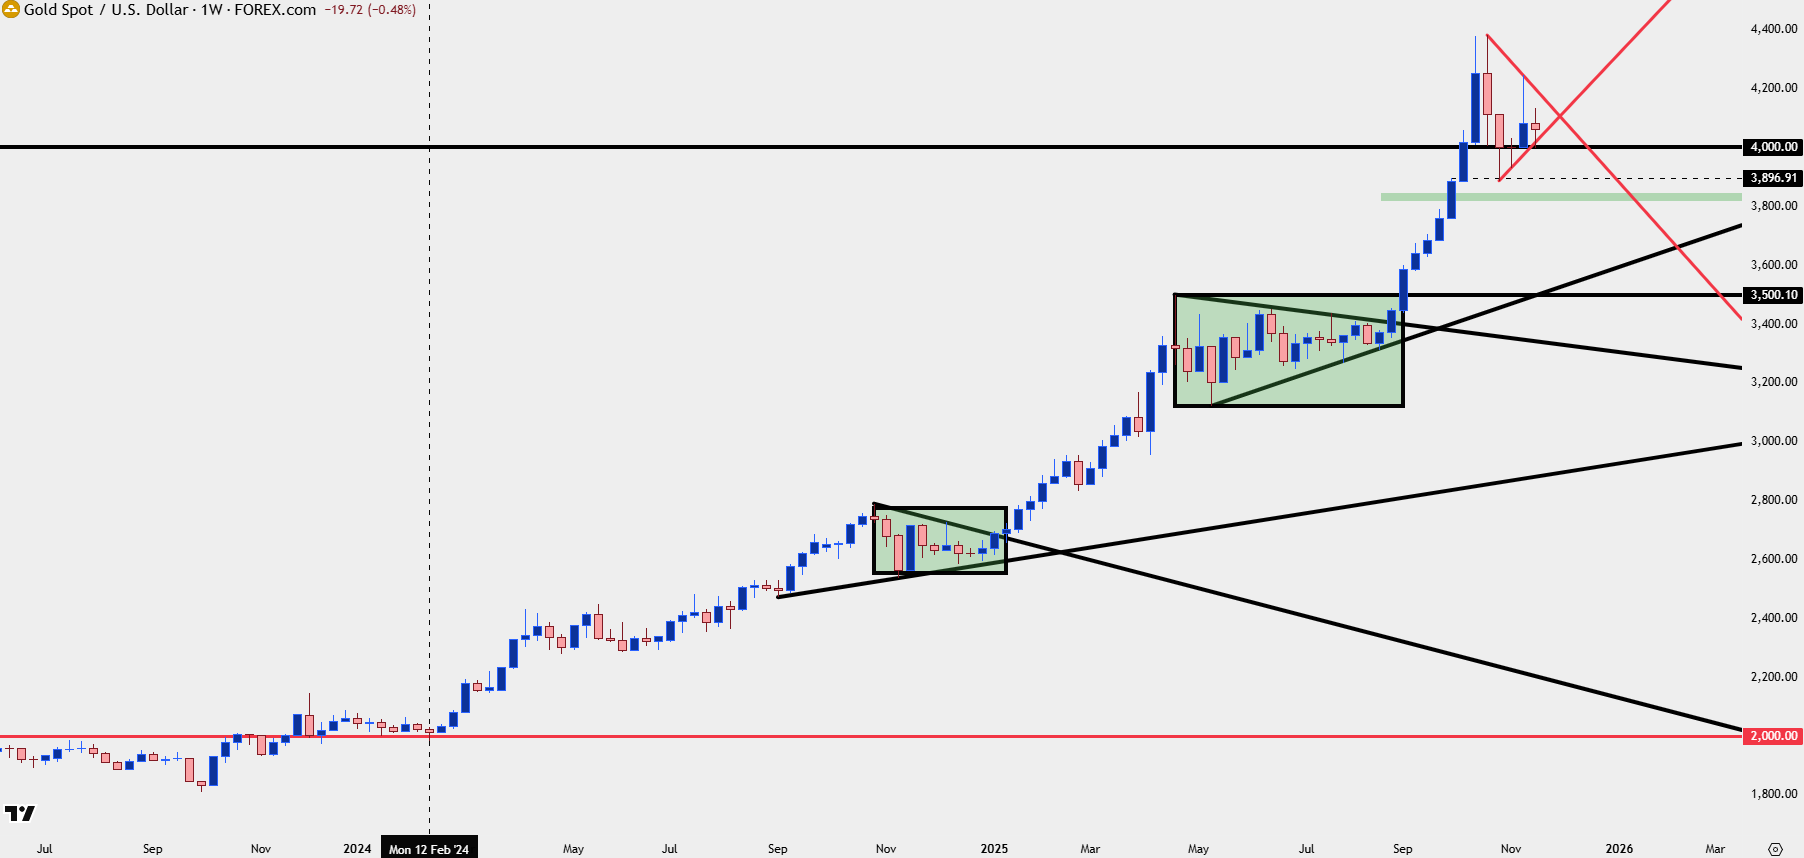
Chart prepared by James Stanley; data derived from Tradingview
Gold Structure
Given the recent consolidation, there are quite a few levels that can be worked with: The 4044 level that I’ve been writing about was support for four of the five days last week, and five of the past six trading days. Notably – there were no daily closes below that price. And the $4k level, of course, looms large as a major decision point. If we do see that taken out, that would illustrate a possible behavioral change in the market, and that would be something that bulls would want to take notice of as lower-lows would become quite possibly after that fact. In that scenario, it’s the 3895-3916 zone that would stick out for next support.
For resistance, 4100 was the big spot last week with four of five days showing highs around that price, with no daily closes above, and then it gets a bit messier, from 4145 to 4161 where there’s a few different price levels and a few different reasons for sellers to step in. For topside, it’s 4250 that stands out and that’s the level I want to see taken out to get the idea that bigger picture bullish continuation may be on the cards. That would open the door for a run at 4380 and then beyond that, with fresh all-time-highs, it’s the 4500 psychological level that stands out as a significant spot for resistance in continuation scenarios.
Gold Daily Chart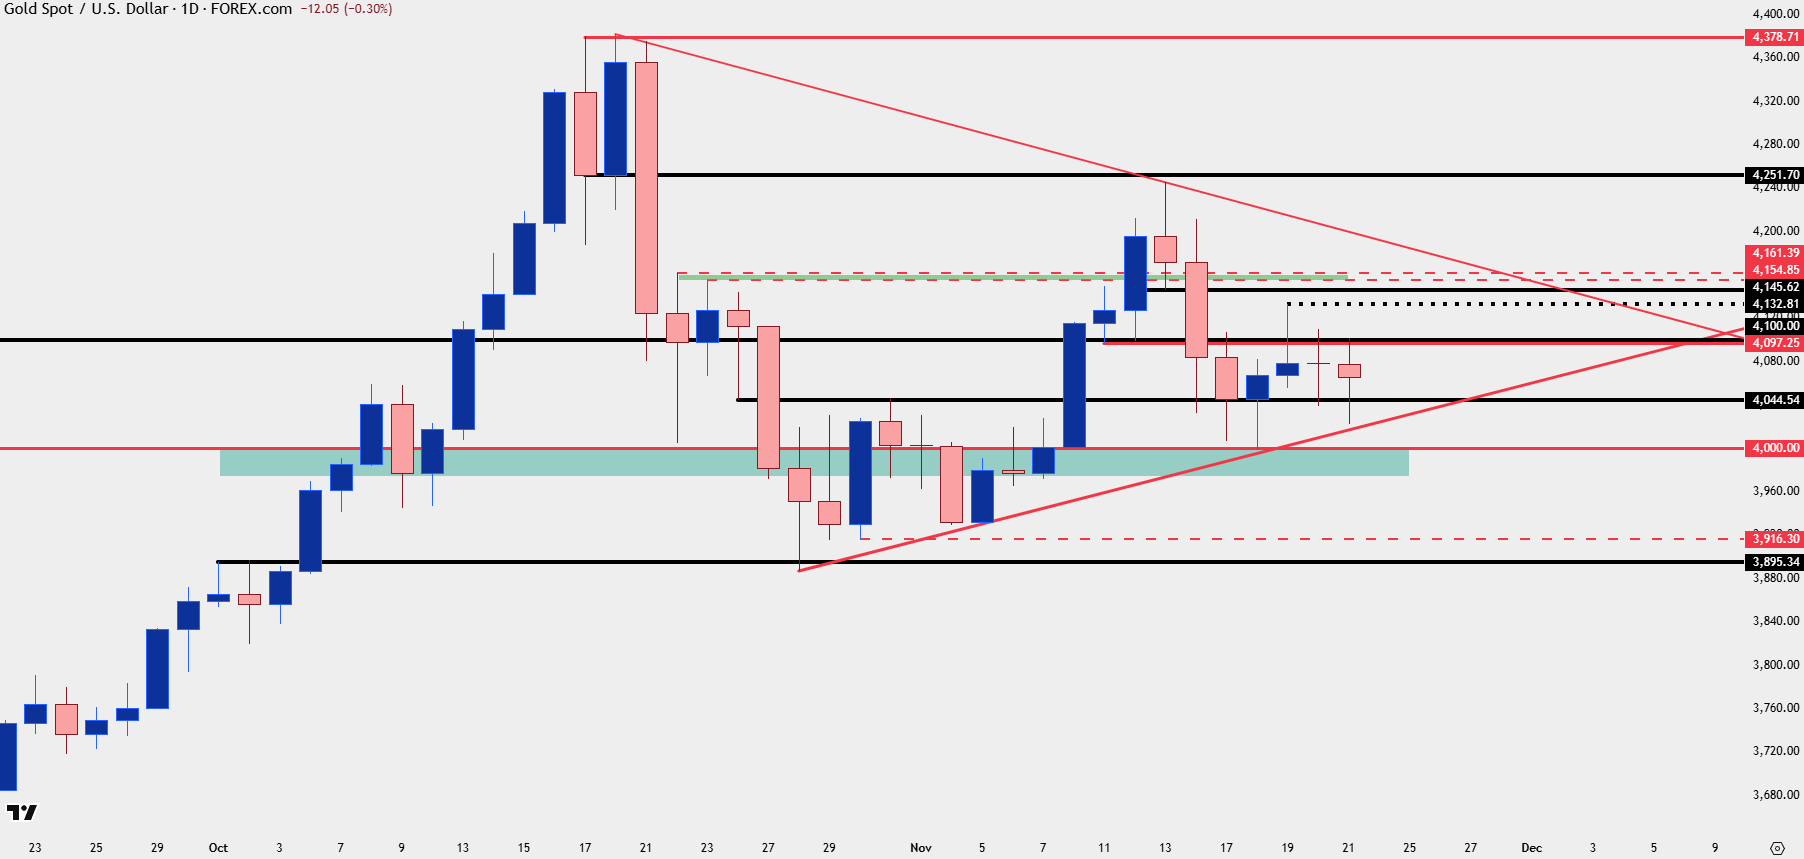
Chart prepared by James Stanley; data derived from Tradingview
--- written by James Stanley, Senior Market Analyst, Global Macro