Gold prices have put in a strong bounce from the $4,285 level as buyers vie to hold the metal above $4300 into a heavy batch of event risk. If we do see strength in the labor market or higher-than-expected inflation data, there could be an opening door for a pullback in gold. But on a bigger picture basis, pullback can be seen as opportunistic for longer-term themes.

Well, at this point the most recent consolidation in gold has been short-lived on a relative basis. The metal found resistance in late-October at 4380 and that led to around a month of digestion and consolidation as price action narrowed into a symmetrical triangle pattern, making up a bull pennant formation. That was the third such technical formation that’s shown in the past year and change, as a similar backdrop appeared in the final two months of last year and another for four months this year, from the April high of $3500/oz until the August breakout.
Gold Weekly Chart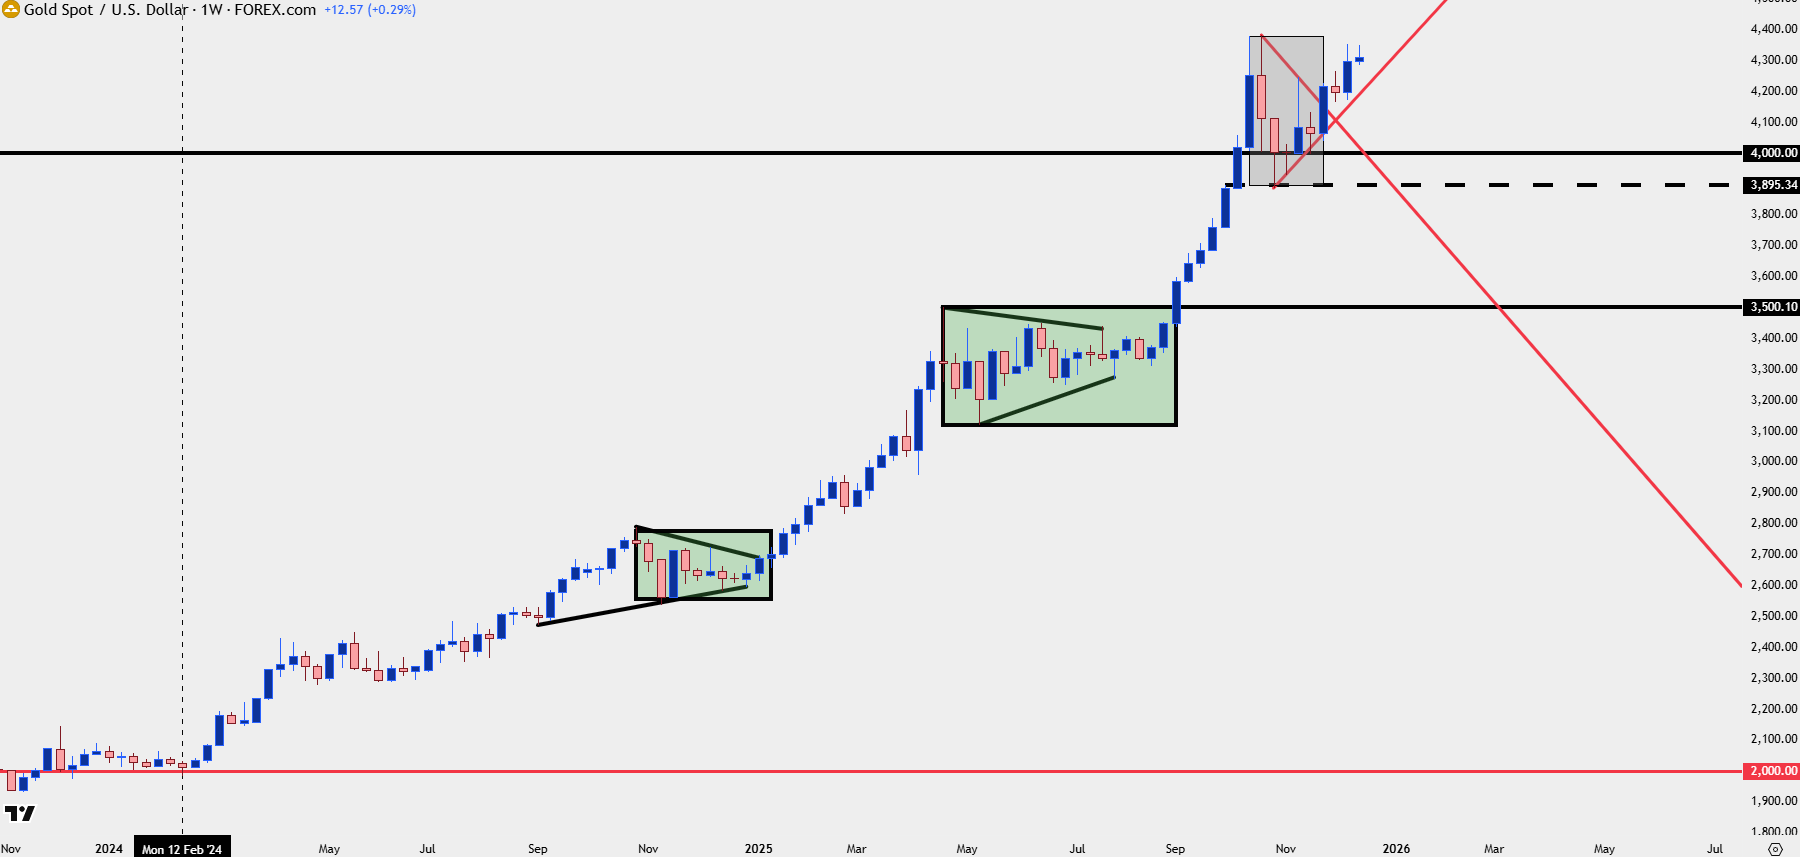
Chart prepared by James Stanley; data derived from Tradingview
Gold Bullish Structure
I looked at gold a few different times into and around the FOMC meeting, including the morning of, and in each the focus was on bullish price structure as produced by the recent breakout from the bull pennant formation.
So far, we’ve seen buyers getting more comfortable with the $4300 level but given the upper wick on Friday’s daily candle with another showing for today, it’s clear that these rallies have led into some profit taking from longs, and this can further complicate continuation stances.
But with that said, there’s now bullish structure to work with from the recent continuation push, and it’s the $4250 level that stands out as key as this was resistance on multiple occasions and hasn’t yet shown as support. The level that buyers need to hold lows above to allow for higher-lows would be the swing level that came into play ahead of the Fed last week, and that plots at $4180. This was the key support that held for five of seven days before last week’s Fed-fueled breakout.
And on a shorter-term basis, the $4285 level is of interest as last Thursday’s high has so far held the lows for this Monday’s daily bar.
Gold Daily Chart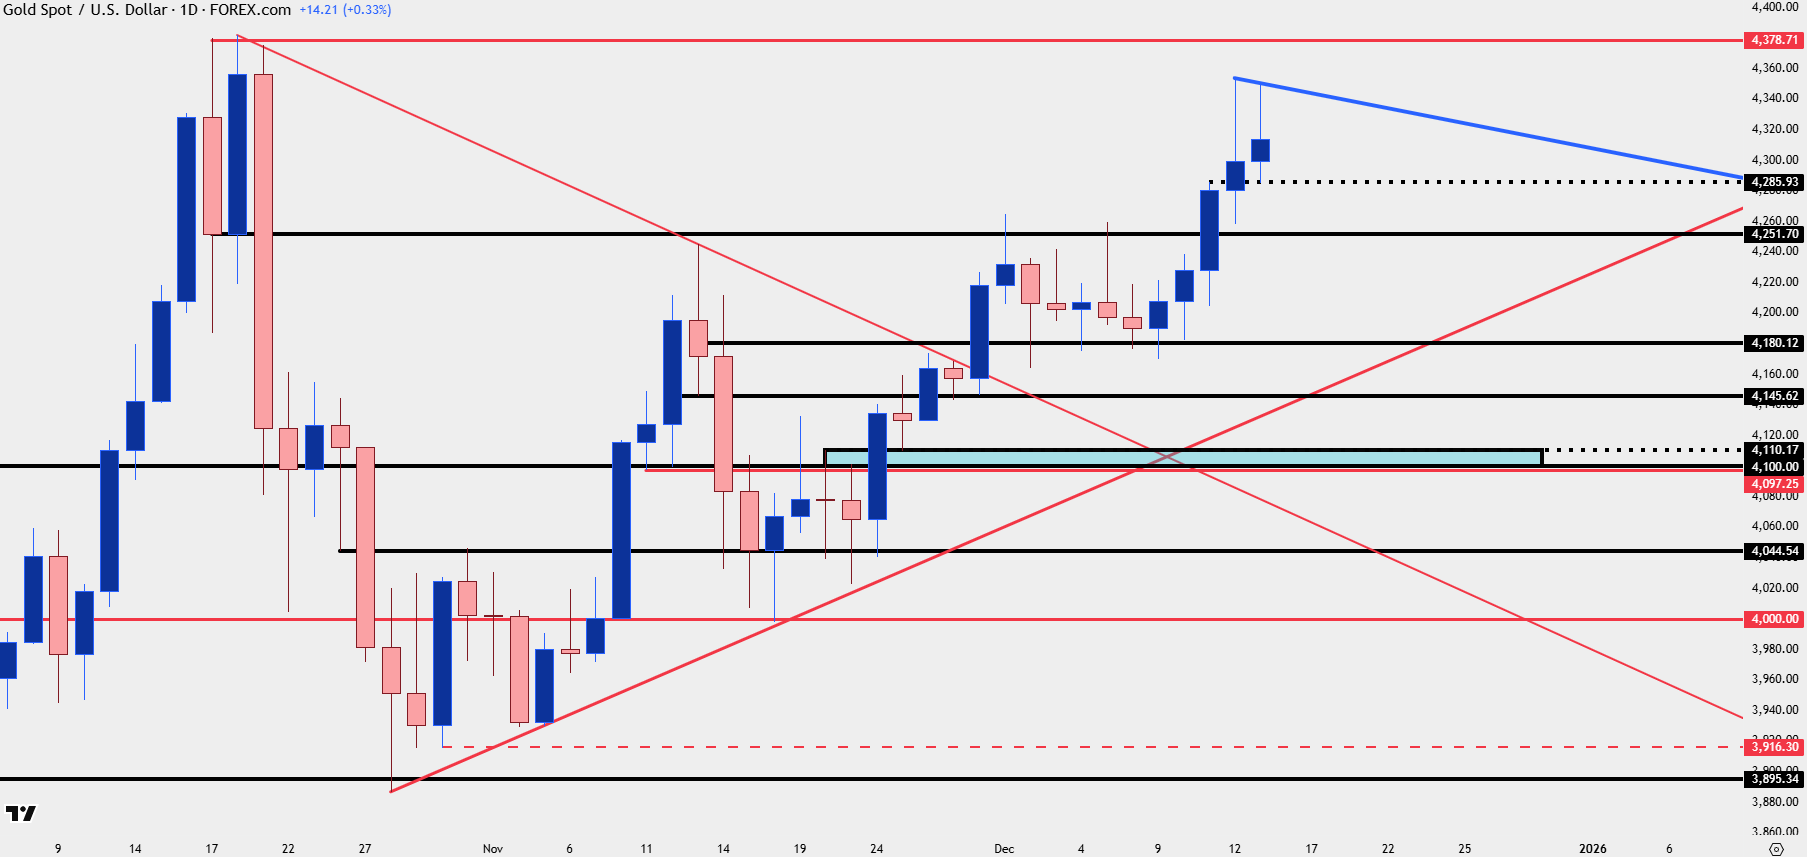
Chart prepared by James Stanley; data derived from Tradingview
Gold Short-Term Structure
Wicks from the four-hour chart over the past couple of weeks highlight an important theme, and that’s the bullish defense noted above with both 4180 and 4250 playing a big role in the metal’s advance. But more recently, its that $4285 level which set the high on Thursday and then showed as a big line of defense earlier this morning.
Ideally, for bullish momentum, buyers will defend that line in the sand so that it can be said that a higher-low showed topside anticipation. If the labor market impresses in NFP tomorrow, there can be a case for deeper profit taking as we’ve so far seen stall inside of the $4380 ATH, and in that scenario, 4250 becomes important as this clear spot of prior resistance hasn’t yet been re-tested as support; and interestingly, it was the reaction on Friday that showed a higher-low above that price.
Gold Four-Hour Chart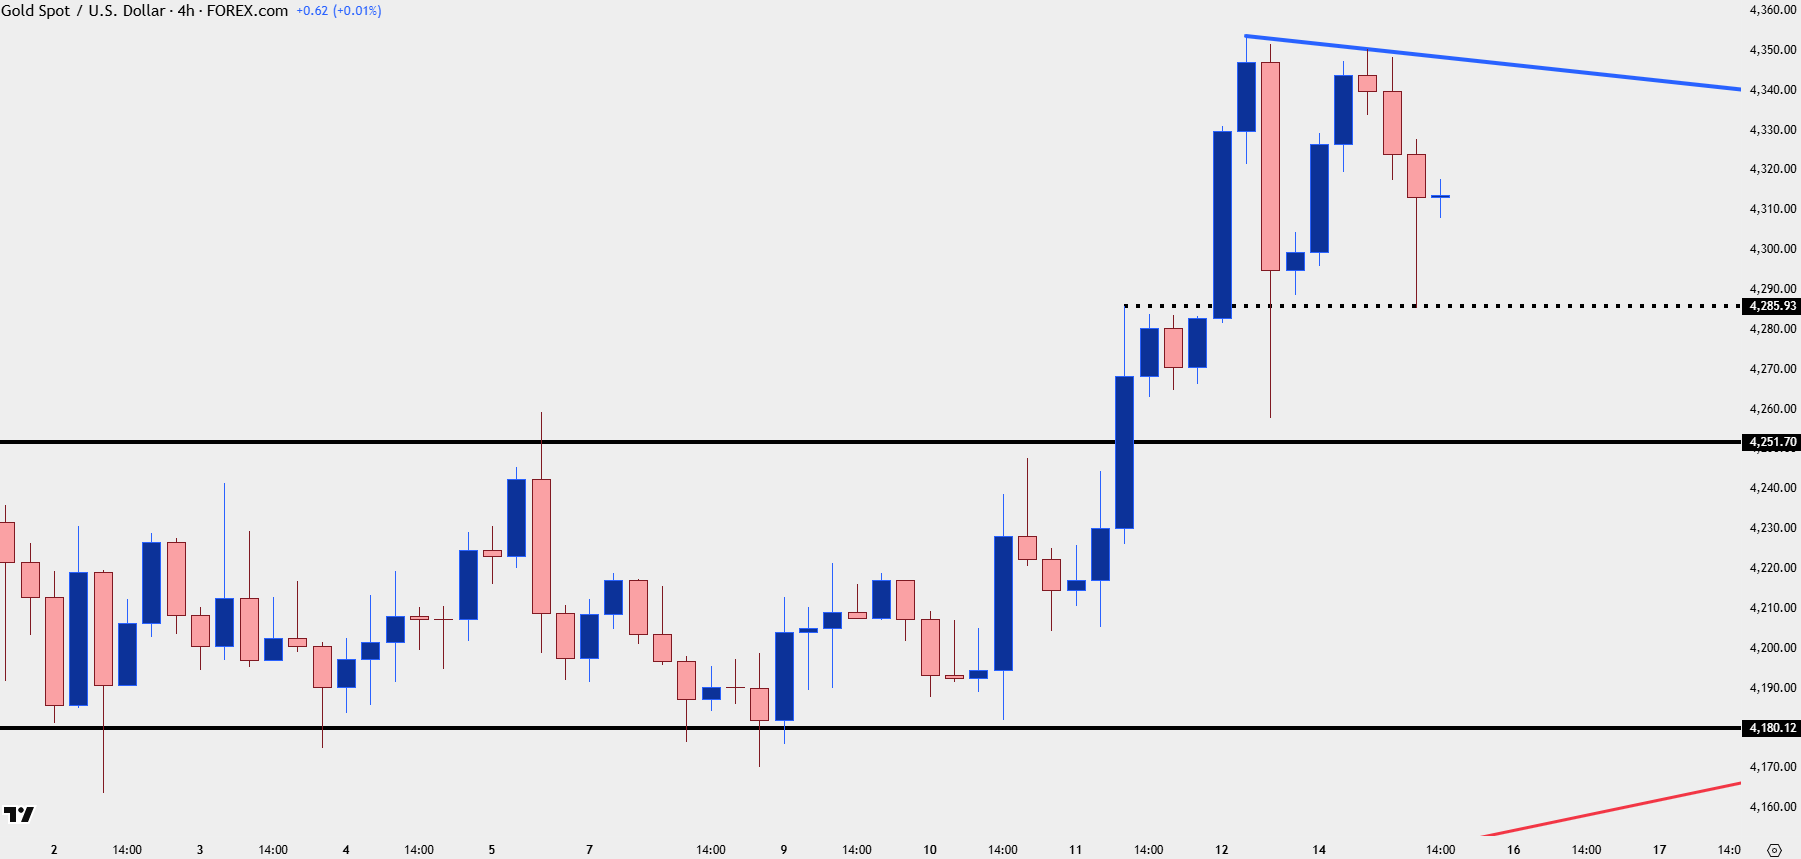
Chart prepared by James Stanley; data derived from Tradingview
--- written by James Stanley, Senior Market Analyst, Global Macro