Gold has extended its rally for a third consecutive session, starting the week with a strong bullish bias and gaining over 4% in recent days. For now, buying pressure remains firm, driven by the renewed trade tensions between the United States and China, which have fueled steady demand for the metal as a key safe-haven asset. As these tensions continue to escalate, bullish momentum could become even more significant on the chart in the coming sessions.

Is the Trade War Returning?
The final session of last week marked a key event for market risk sentiment. The United States announced tariffs of up to 100% on certain Chinese imports after it was revealed that the Chinese government had blocked exports of rare earth minerals, essential for the U.S. microchip industry. In response, China has not remained idle—it has started imposing tariffs on ships arriving from the U.S. and sanctioning subsidiaries tied to American corporations.
For now, the measures announced by the Trump administration are expected to take effect on November 1st, though both sides could increase tariff levels if no early agreements are reached. So far, there have been no concrete negotiations to ease the tension, making the coming weeks crucial in determining whether the world’s two largest economies are heading toward a renewed trade war.
This revival of trade hostilities has fueled a wave of economic uncertainty, as the potential impact on the global economy toward the end of the year remains unclear. As a result, investors have sought safe-haven assets like gold, while capital outflows from risk assets, especially U.S. equities, have intensified. In times of market instability, gold tends to reaffirm its role as the ultimate safe-haven asset, attracting consistent demand in the short term.
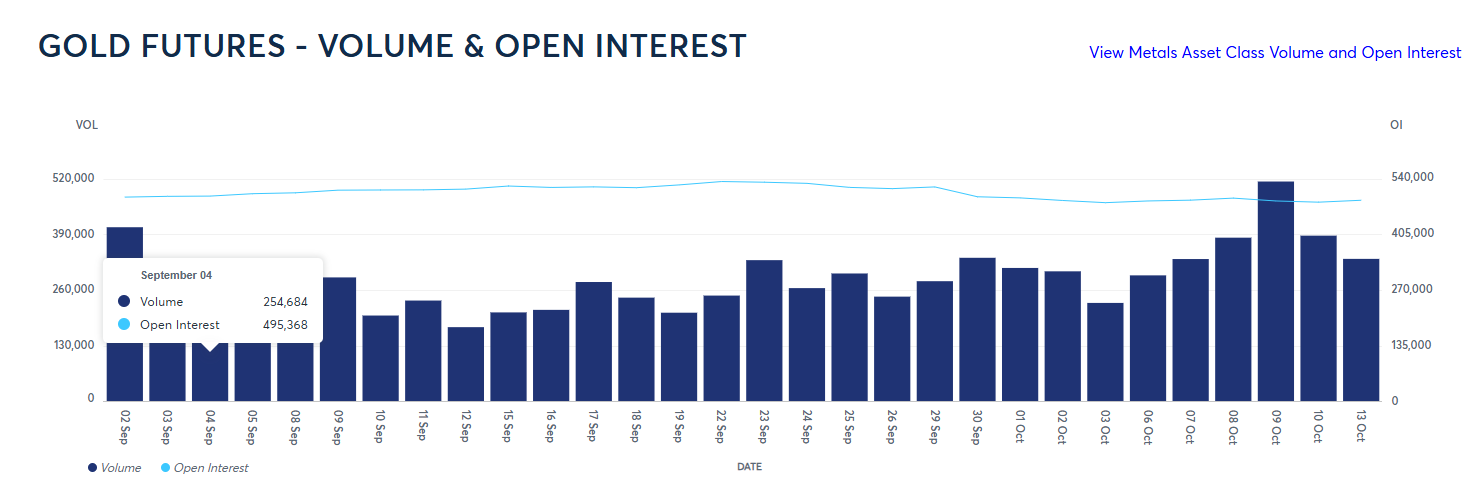
In fact, trading volume in gold futures has been rising steadily since Friday, October 3, reaching levels not seen since early September, with over 500,000 contracts traded—even before the latest trade conflict was announced. Open interest, which reflects total outstanding positions in futures, remains stable at around 485,000 contracts, showing no significant capital outflows. This confirms continued demand for gold futures, aligning with the metal’s ongoing bullish trend. If trade tensions continue to escalate, trading volume could become even more significant in the days ahead.
Source: CMEGroup
In summary, recent geopolitical events have helped gold maintain its momentum and consolidate strong demand in the short term. As long as no tangible progress is made in negotiations to ease concerns about a renewed trade war, gold is likely to keep attracting investment flows as a safe-haven asset, reinforcing dominant buying pressure in the short term.
Is Market Confidence Falling?
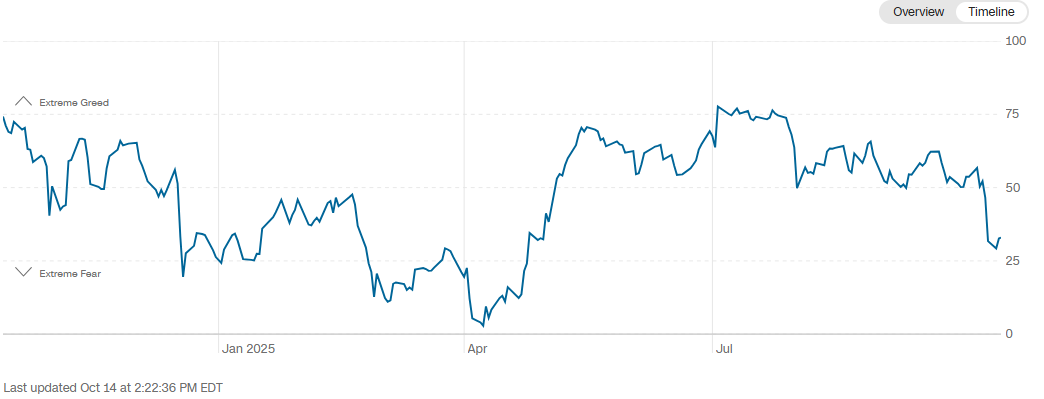
The new wave of trade tensions has also had a negative impact on market sentiment. In recent days, CNN’s Fear & Greed Index has dropped sharply to 33 points, nearing the “Extreme Fear” zone. This indicates a significant rise in risk aversion, prompting investors to shift from risk assets toward safer holdings.
Source: CNN
In this environment, gold remains the most sought-after safe-haven asset globally. As long as confidence fails to rebound, risk perception will likely continue to fuel steady demand for the metal. Should the index fall deeper into the extreme fear zone, buying pressure on XAU/USD could strengthen further, potentially driving prices higher in the coming sessions.
Technical Outlook for Gold
Source: StoneX, Tradingview
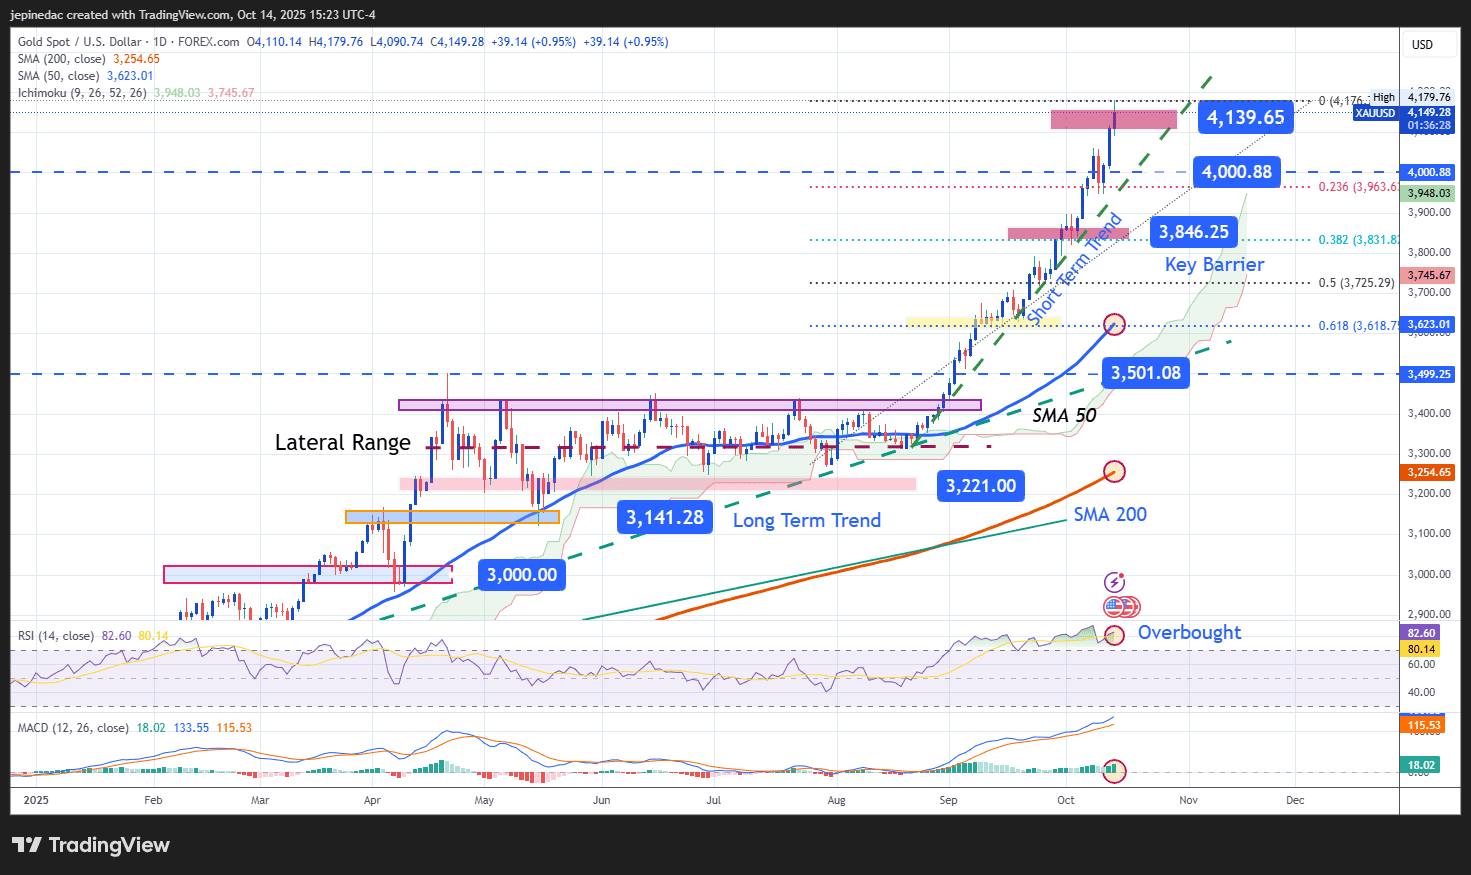
- Strong Uptrend in Place: Since late August, gold has maintained a solid and consistent bullish trend, showing no significant downside corrections that would threaten its structure. This confirms that the dominant bias remains clearly bullish. However, the rapid pace of price appreciation and the continuous sequence of new record highs may open room for technical pullbacks in the short term.
- RSI: The RSI line has remained in overbought territory for several weeks, with readings above 70—a situation not seen since the COVID-19 era. This suggests that the buying momentum may be overstretched, creating an imbalance between buyers and sellers, which could lead to gradual corrections in the coming sessions.
- MACD: The MACD histogram remains above the neutral line (0), confirming a strong bullish bias in the short-term moving averages. As long as the histogram continues to rise, buying pressure is expected to remain dominant, even if the market experiences brief consolidation phases before extending the uptrend.
Key Levels to Watch:
- $4,100 – Major Resistance: Coincides with recent all-time highs, marking the most significant barrier for buyers. A sustained break above this level could trigger a more aggressive bullish trend in the short term.
- $4,000 – Near-Term Support: A psychologically relevant level, aligned with the 23.6% Fibonacci retracement, acting as a potential support zone during short-term pullbacks.
- $3,840 – Critical Support: The most important short-term support, aligned with the 38.2% Fibonacci retracement. A drop below this level could endanger the current uptrend and signal a shift toward a moderate bearish bias.
Written by Julian Pineda, CFA – Market Analyst
Follow him on: @julianpineda25