
- Iron ore slumps following Golden Week holidays
- Chinese steelmaker losses deepen as iron ore inventories rise
- October historically the weakest month for Dalian iron ore
- Bearish momentum builds, but major support presents two-way risk
Iron ore has come under heavy selling pressure since Chinese markets returned from Golden Week, leaving the price testing a critical support zone that has sparked some substantial rebounds in the past.
However, it's not just the technical picture that remains firmly bearish. Fundamental pressures on Chinese steelmakers are showing few signs of easing, while historical seasonal patterns suggest October can be an ugly month for iron ore bulls, creating something of a perfect storm when it comes to fundamental and technical conditions.
Chinese steelmakers feeling the squeeze
When it comes to fundamental factors, the profitability of Chinese steelmakers has long been a key input influencing iron ore demand.
According to the latest survey from Mysteel, released during China's Golden Week, just 6.93% of surveyed steelmakers were operating profitably in early October, highlighting the intense financial pressure facing the sector. The survey also revealed widespread pessimism about the iron ore price outlook, with 94% of respondents expecting prices to fall following Golden Week. And as we've seen since Chinese markets reopened, that's exactly what's played out.
The pessimism can be explained by widening losses at mills operating with blast furnaces. According to Mysteel's September survey, average rebar margins fell to -¥204 per tonne, while losses on hot-rolled coil reached -¥213 per tonne, suggesting the pressure on steelmaker profitability extends well beyond China's struggling construction sector into manufacturing.
Escalating losses raise questions about how long mills will be prepared to maintain production at current levels, particularly with iron ore inventories at major Chinese ports lifting by a further one million tonnes to 173.15 million tonnes last week, according to Mysteel data.
October has been an ugly month for iron ore bulls
Potentially compounding the fundamental headwinds, seasonality also offers little comfort for bulls.
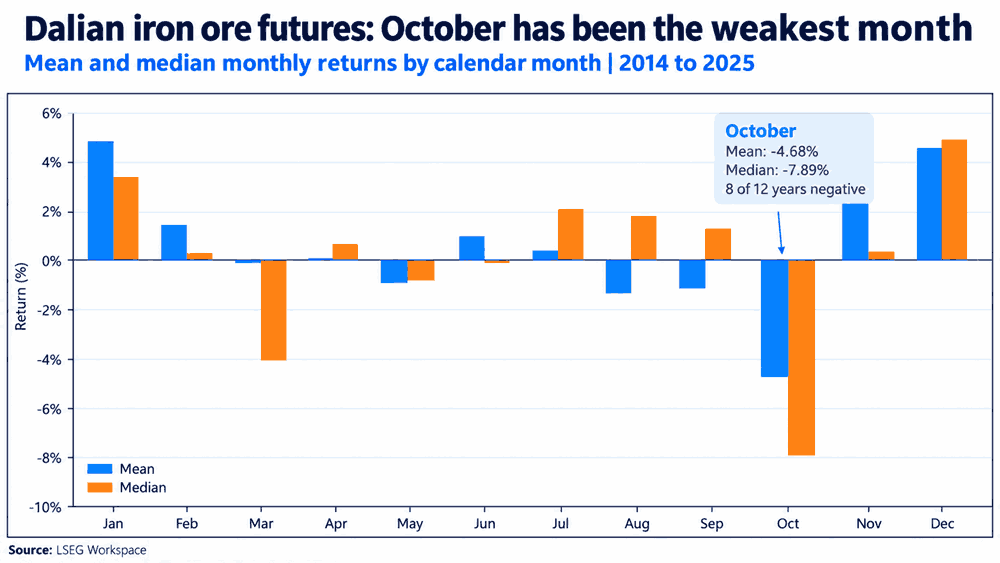
Source: LSEG
Looking at Dalian iron ore futures since 2014, October has delivered an average decline of 4.68%, making it the weakest calendar month over the period. The median return is even worse at -7.89%, with eight of the past 12 Octobers producing losses.
While such a small sample size is hardly a definitive signal you can hang your hat on, seven of those 12 Octobers have recorded declines exceeding 6%, highlighting just how severe the selling can be.
Post-Golden Week selling has often been severe
Not only is October seasonally a weak month, but in more recent times, the period following the return of Chinese traders from the Golden Week holidays has often seen large declines, fitting with what we've witnessed so far this year.
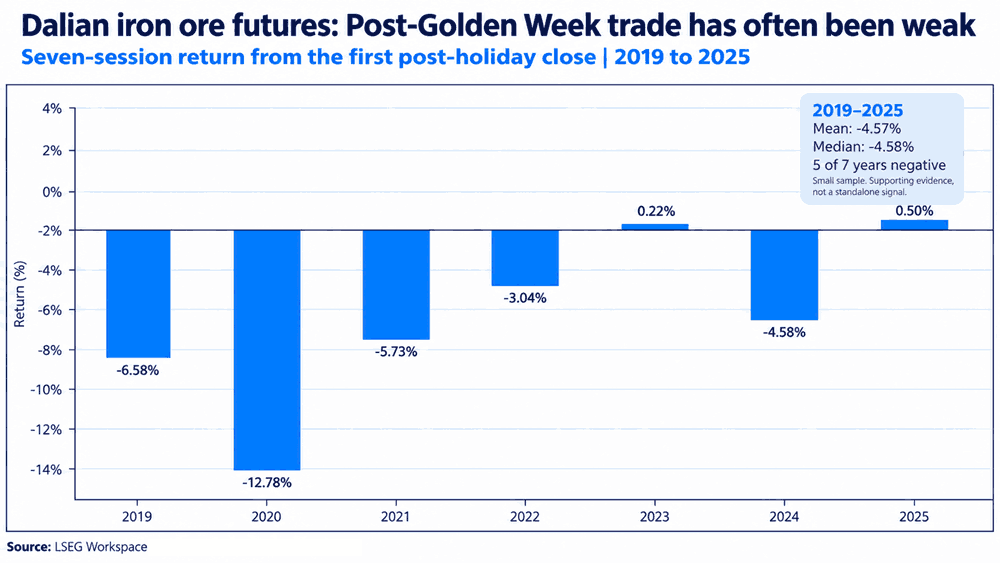
Source: LSEG
Over the seven trading sessions following the first post-holiday close, Dalian iron ore futures have recorded an average decline of 4.57% since 2019, with the median return almost identical at -4.58%.
While, again, that's an incredibly small sample size, what the graphic below shows is that even in the years when prices have risen, the gains have been far smaller in magnitude than the declines recorded in negative years.
Decision time
Even before considering seasonality and post-holiday trading patterns, what initially drew my interest to iron ore was just how obedient the price action has been to technical levels.
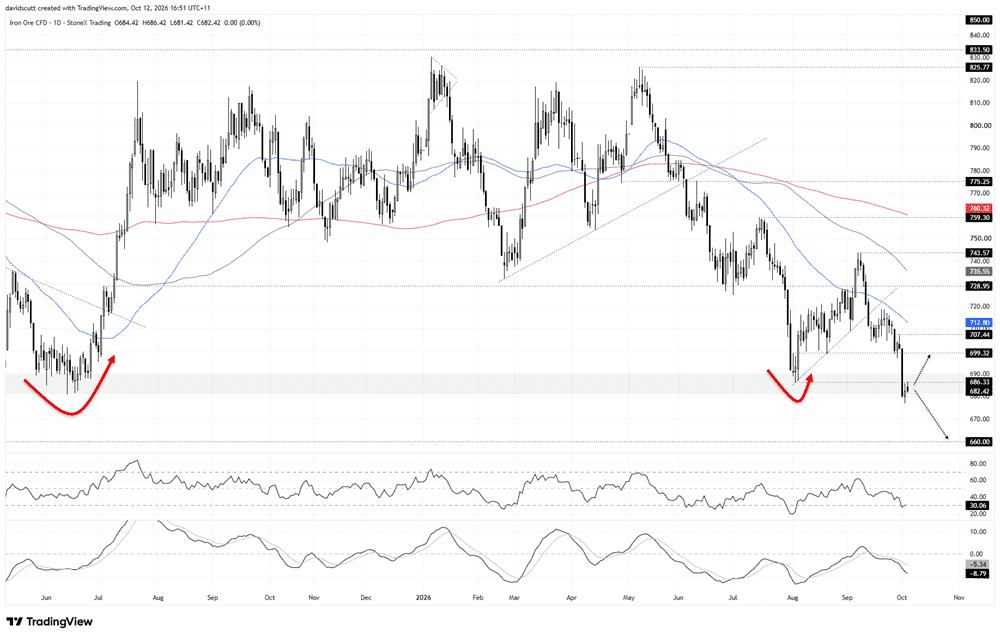
Source: TradingView
Having staged a corrective bounce in late August following a pronounced decline through support at ¥728.95, the price briefly reclaimed its 50-day moving average before stalling at ¥743.57. From there, the short-term uptrend was obliterated, with a fleeting recovery in September unable to recapture the 50-day moving average before the price sliced beneath support at ¥699.32.
That brings us to where we are now, with the price stalling within an important support zone running from ¥690 down to ¥683 following the pronounced post-Golden Week selloff. Having briefly dipped beneath the June low late last week, we've seen a recovery in the period since, putting the August swing low at ¥686.33 in focus immediately overhead. The price stalled at that level earlier in today's session, making it particularly relevant for traders right now.
Looking at the oscillators, downside momentum continues to build. RSI (14) has been setting lower highs and is now sitting just above 30, while MACD has crossed beneath its signal line in negative territory, with the two lines continuing to diverge. Throw in the fact that the price is trading beneath all its key medium and long term moving averages, and the broader technical picture feels decidedly heavy.
The risk is that a sustained break beneath ¥683 opens the door to a deeper bearish unwind towards ¥660, a level that sparked substantial rebounds in May 2023 and September 2024. However, if sellers can't force a meaningful break beneath current support, the potential for another countertrend squeeze remains, leaving genuine two-way directional risk despite the weight of evidence favouring the bears.