


Japanese Yen Talking Points:
- USD/JPY sold off aggressively on the back of the NFP report but since the Monday after that release the pair has held a key Fibonacci level as support.
- EUR/JPY and GBP/JPY were both similarly hit by that NFP report, illustrating how rate cut expectations in the US could have a large impact on the Japanese Yen, even in pairs that don’t include the US Dollar.
- I’ll be looking at updated setups in the Yen in tomorrow’s webinar, and you’re welcome to join. Click here to register.
It was a fast and furious breakout in USD/JPY after the July FOMC meeting and the BoJ meeting that followed. USD/JPY ran all the way up to a Fibonacci level at 150.77 and then started to stall, but the NFP report on Friday of that week saw the breakout clawed back. At the source of the move are rate cut expectations and given USD/JPY’s still elevated price from 2021, logically there’s a lot of drive from the carry trade still hanging on here. As we get closer to an actual rate cut from the Fed, motivation can drive hedges to close in anticipation of narrowing rate differentials, very similar to what had showed last July.
As inflation data in the US has remained high, the prospect of rate cuts from the Fed has dimmed and this caught a shot-in-the-arm at the July FOMC rate decision when Jerome Powell didn’t sound too certain about cutting rates at the bank’s next meeting in September. That helped USD/JPY to climb above the 150.00 level and then the BoJ meeting later that night doused more kerosene on the breakout, which was further helped by the PCE report a day later that showed US inflation growing even more.
This highlights a wedge, between President Trump and FOMC Chair Jerome Powell. As Powell said at the FOMC press conference, he didn’t see policy as overly restrictive given the growth in inflation to go along with a healthy unemployment rate. The next chapter in that saga will play out later this week when Powell gives his speech at what will likely be his final Jackson Hole Economic Symposium atop the bank.
In USD/JPY, the pair has largely been range-bound since the NFP-fueled sell-off a day after that Core PCE report. There’s been bullish motive on a shorter-term basis, which I’ll look at below.
USD/JPY Daily Chart
Chart prepared by James Stanley; data derived from Tradingview
USD/JPY Four-Hour
There’s been a case of divergence between the USD and USD/JPY going back to April. In April, both markets plummeted with USD/JPY re-testing the 140.00 level. But since then, USD/JPY has held higher-lows even as USD drove down to a fresh three-year low on the first day of Q3. More recently, that divergence has remained as the past two weeks of range in USD/JPY contrasts against the fresh lower-low in USD that printed last Wednesday.
On a shorter-term basis, there’s even the argument for bullish scope in the pair as shown from an ascending triangle formation, taken from higher-lows to go along with horizontal resistance around the 148.00 handle.
USD/JPY Four-Hour Chart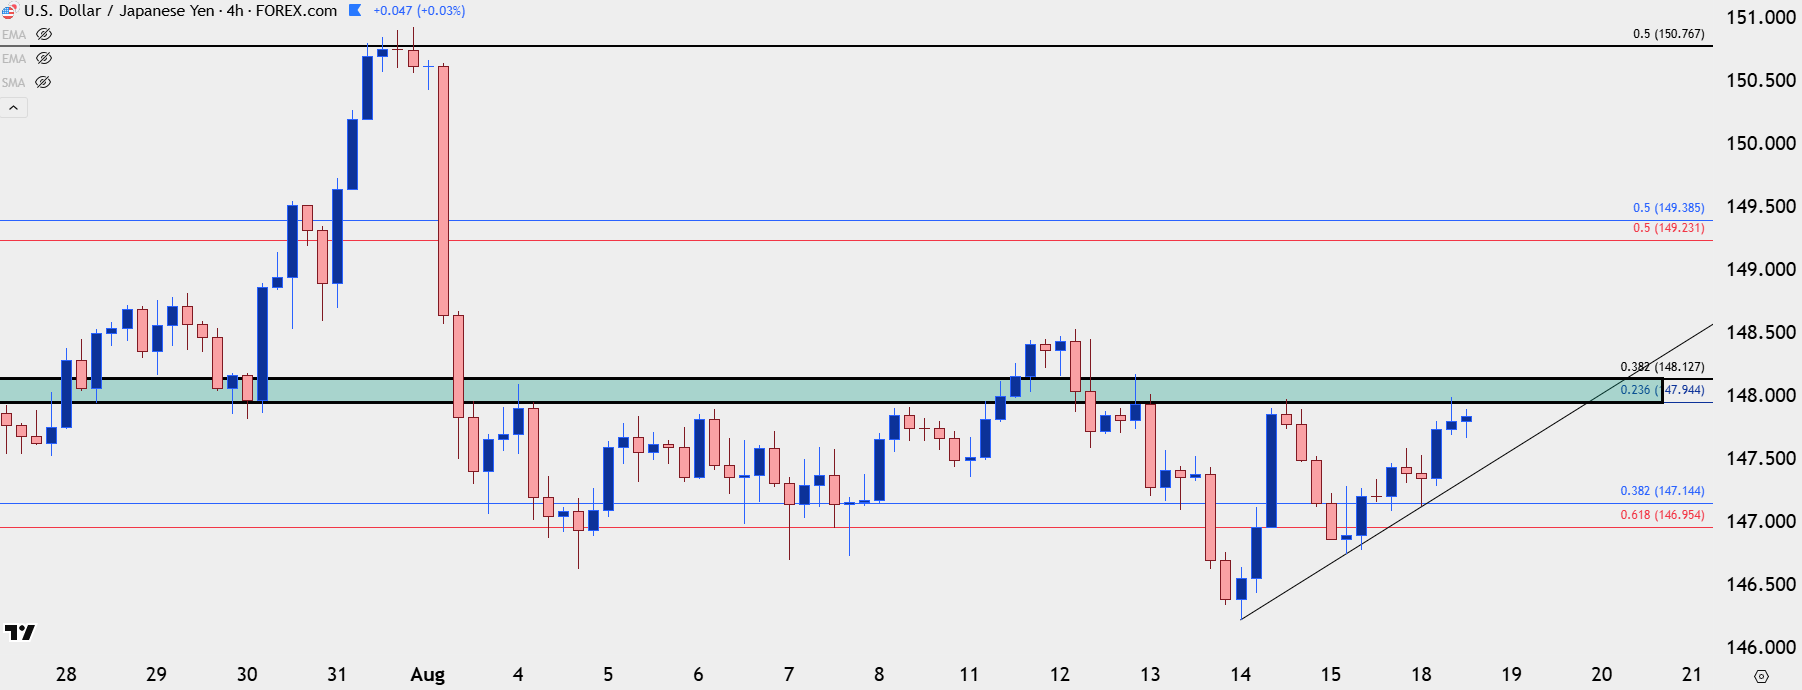
Chart prepared by James Stanley; data derived from Tradingview
EUR/JPY
EUR/JPY was a high-flyer into the FOMC/BoJ week but a significant sell-off showed shortly after that weekly open. The Monday bearish engulf ran all the way until prices tested below the 170.00 level as we moved into the BoJ rate decision that night.
But, as the Bank of Japan didn’t sound too close to rate hikes, JPY-weakness came rushing back, allowing for a 61.8% retracement of that prior sell-off.
It’s what happened after that that’s of interest…
The pair sold off on the back of the NFP report, similar to USD/JPY above. But – that same 170.00 level soon came back into play and bulls did a good job of holding support there, allowing for a higher-low. I had looked at the setup in these articles and that allowed for buyers to get back in the driver’s seat, running all the way up to the 78.6% Fibonacci retracement of that prior pullback last week.
More recently, there’s been a hold of resistance at the 172.55 level, but higher-lows paint a similar picture of a short-term ascending triangle in the pair. Next resistance is fairly clear at that Fibonacci retracement plotted at the 173.00 level, but if bulls can take that out, the prior high is vulnerable at 173.90.
EUR/JPY Four-Hour Chart
Chart prepared by James Stanley; data derived from Tradingview
GBP/JPY
Pound-Yen was on a similar ride earlier in the month. The pair sold off into the BoJ rate decision after which a flare of Yen-weakness came roaring back. But the NFP report hit hard here and the notable difference is that GBP/JPY scaled down to a fresh low, even as EUR/JPY held a higher-low at that 170.00 level.
More recently, however, GBP/JPY has been stronger, showing a rally up to a fresh high and over the past week, continued testing of the 200-handle for the first time in more than a year.
As covered in the video, that 200-level presents a challenge as chasing the move without any evidence that buyers have yet gained acceptance can lead to deeper pullback scenarios. But, there’s also an ascending triangle here which keeps the door open for bulls and breakout scenarios, while also providing some context for higher-low supports.
GBP/JPY Four-Hour Chart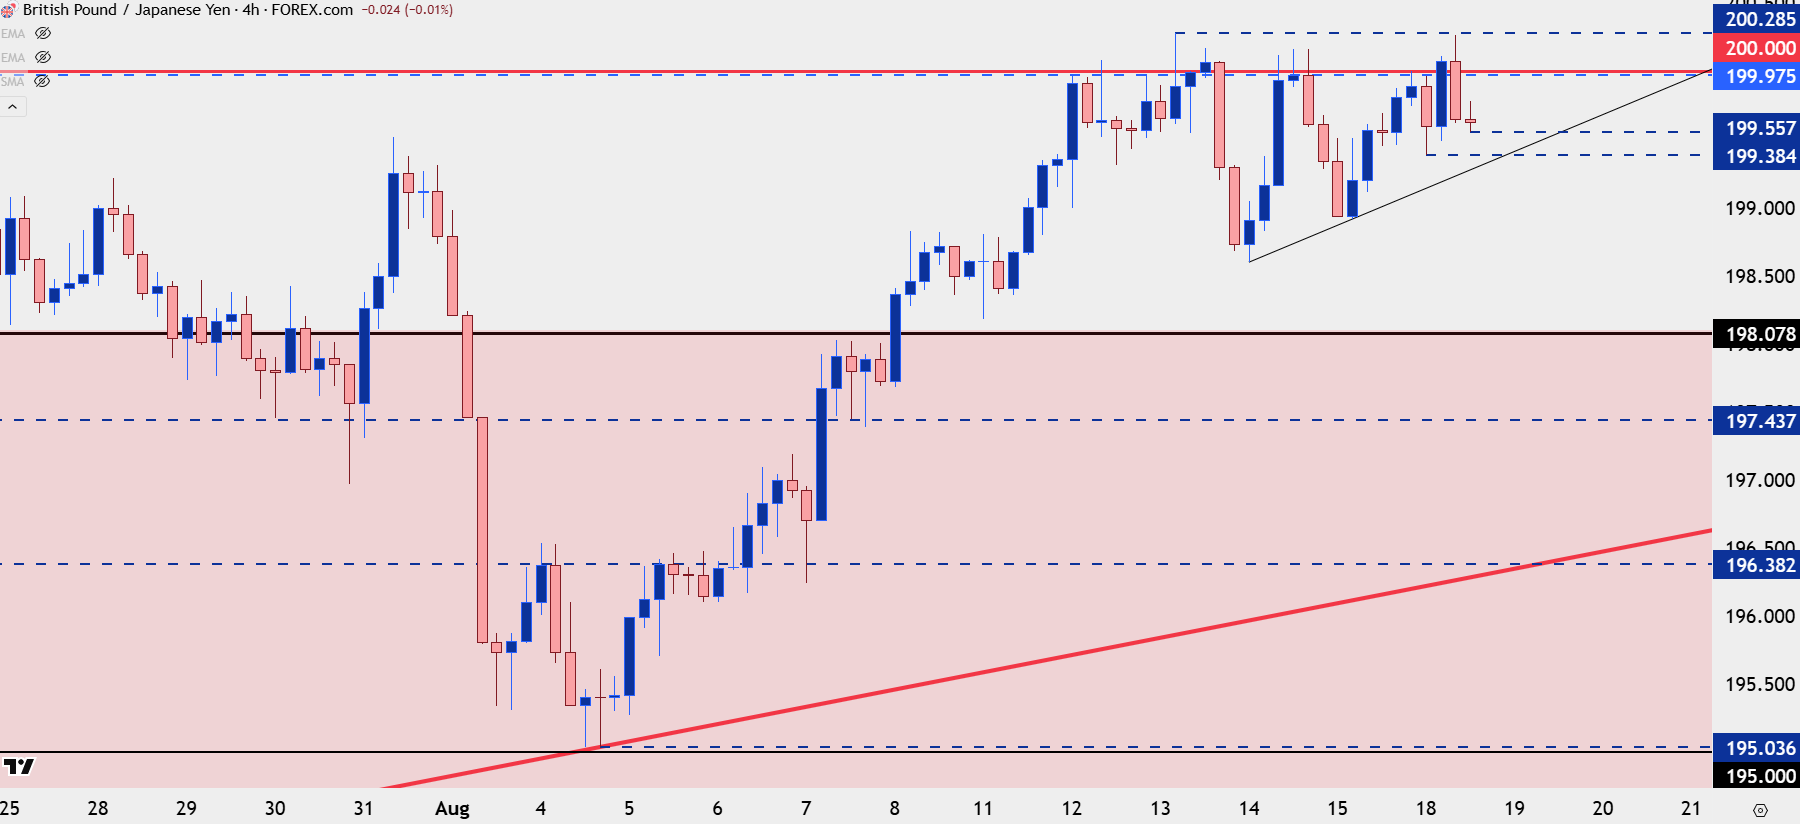
Chart prepared by James Stanley; data derived from Tradingview
--- written by James Stanley, Senior Strategist






