


The Japanese Yen showed strength last week as expectations for a December rate hike from the BoJ built into markets. But perhaps the bigger question is what’s next for the BoJ, and whether the bank will continue to hike rates into 2026 and 2027.

USD/JPY is pushing out of a falling wedge formation that built last week after price found support in the familiar 154.45-155.00 zone. This was an area of prior resistance when the pair was rallying into late-November and so far, it’s held as higher-low support. For USD-strength scenarios, USD/JPY still looks to be one of the more attractive major FX pairs, but for traders looking to avoid USD altogether, Yen-weakness has similarly been on display against both the Euro and British Pound, looked at further below.
USD/JPY
In the major of USD/JPY last week was largely a period of defense. The 154.45-155.00 zone came into play on Monday although buyers were unable to re-take control. Recurrent tests on Thursday and Friday similarly saw holds, but on Friday, bulls started to tip-toe back above the 155.00 level, and as I looked at in the weekend video, USD/JPY retained interest for USD-strength scenarios as we came into Fed week.
That support last week helped to slow sellers at or around lows and that built a falling wedge formation, which is often approached with aim of bullish breakout, such as we’re seeing now.
USD/JPY Daily Chart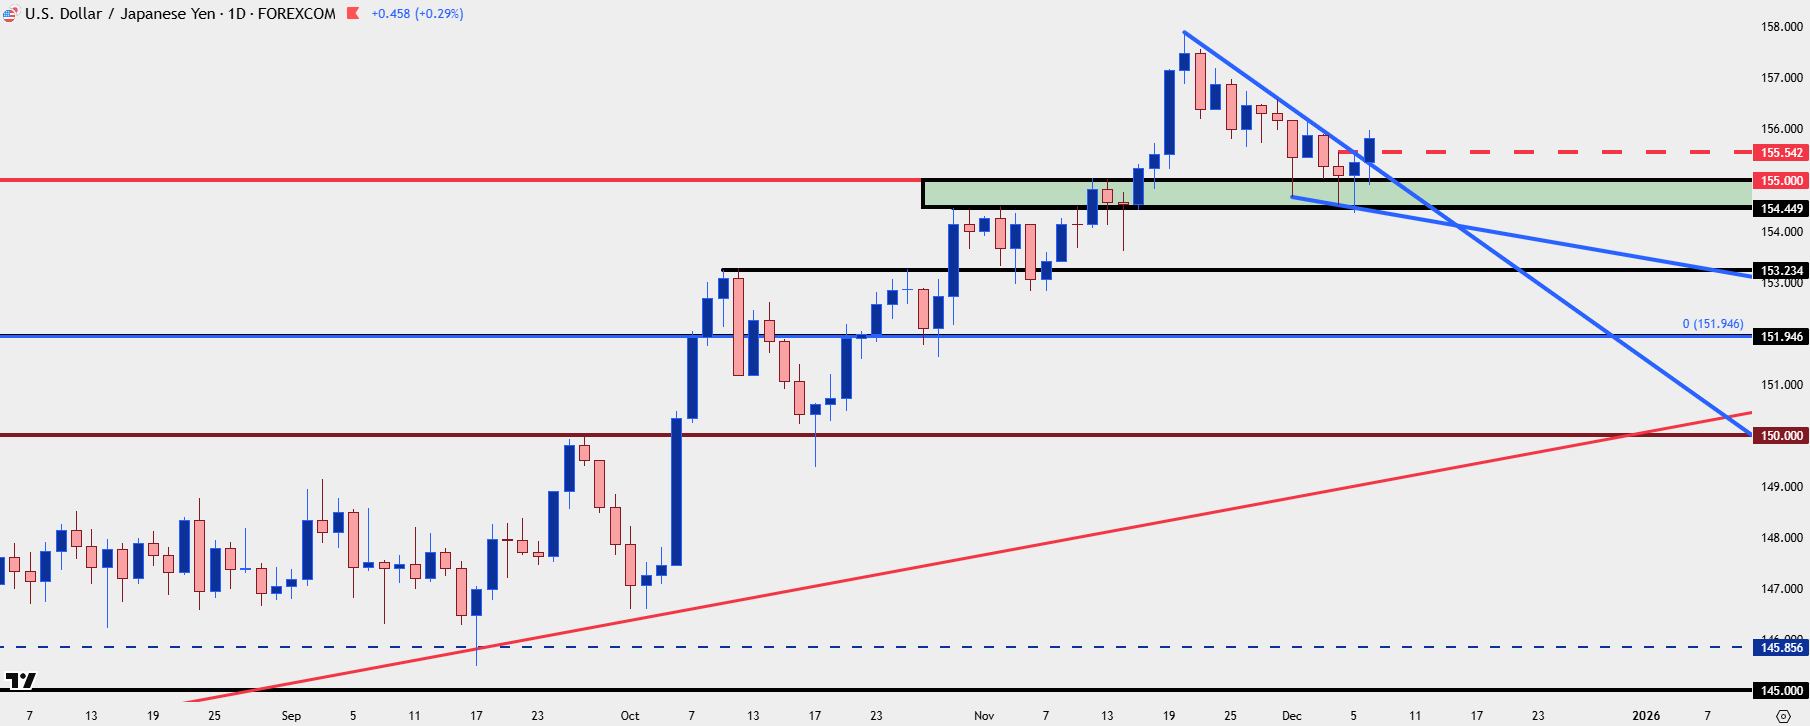
Chart prepared by James Stanley; data derived from Tradingview
USD/JPY
From the four-hour chart we can see the higher-high after the falling wedge breakout and this gives some shorter-term bullish scope to match up with the bigger picture bullish bias. This would also keep the door open for a support test at the 155.00 handle, which could technically qualify as a higher-low given last Friday’s test and hold of the 154.45 level. I’m tracking next resistance up at 156.20, which is a spot of prior support turned resistance.
USD/JPY Four-Hour Chart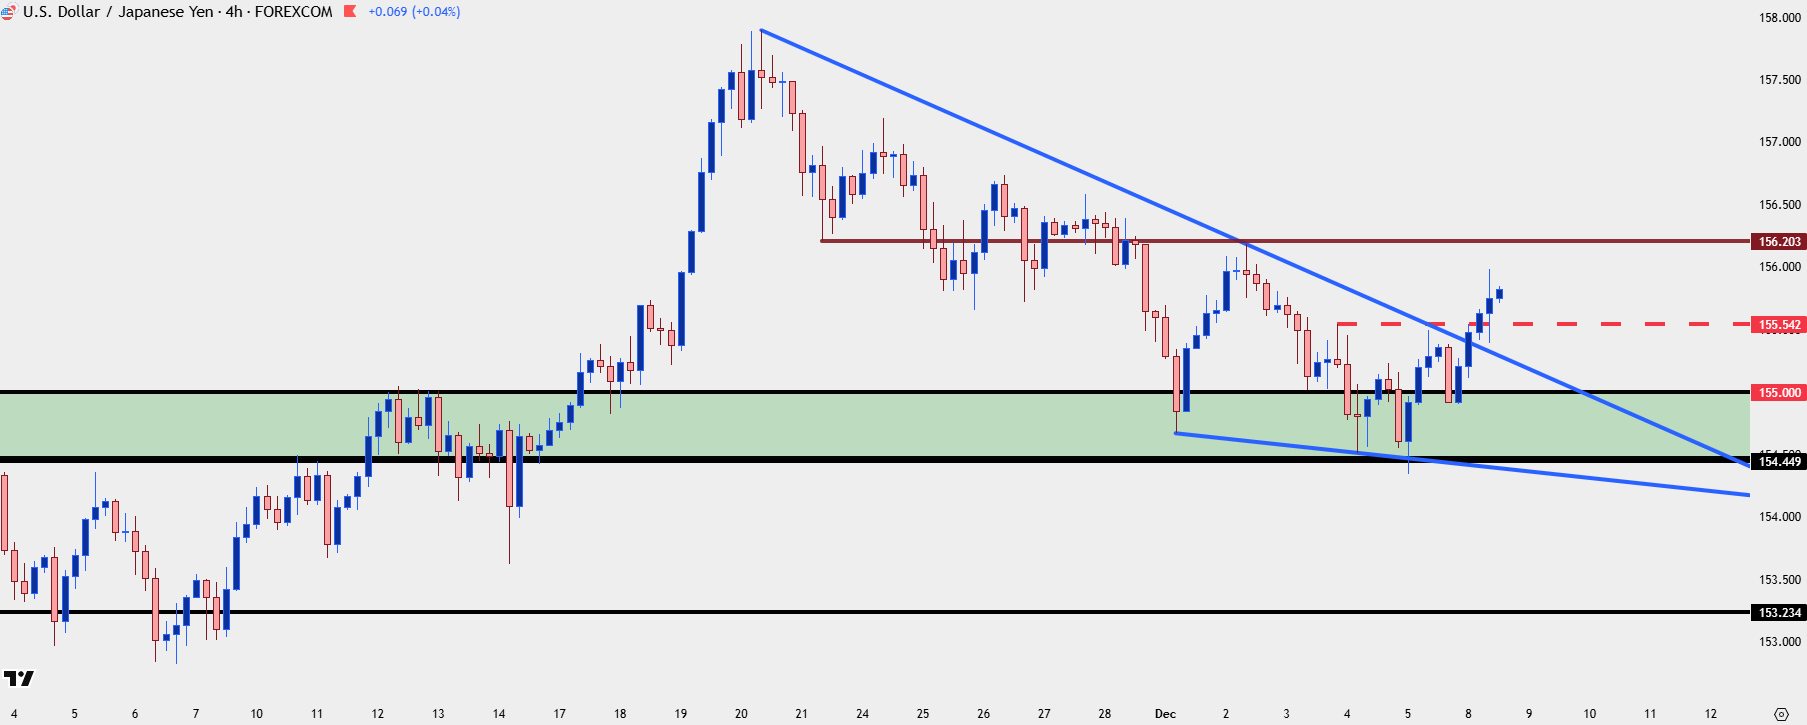
Chart prepared by James Stanley; data derived from Tradingview
EUR/JPY
For the past couple of weeks EUR/JPY has been locked in a consistent range. Unable to break above 182 yet defended multiple times above 180.00, the mean reversion has been clean. Given the holds at resistance, it’s difficult to get excited about chasing the pair so close to resistance – but – if there is a break there’s a couple of different ways to move forward. A break of 181.50 can open the door for a push up to 182 although this would be an aggressive stance. Or – for traders looking to be a bit more patient, waiting for a test of 182.00 to allow for a pullback to support at prior resistance of 181.50 could allow for a trend-like approach to working with breakout scenarios.
Alternatively, if we do see pullback and range continuation, it’s the spot from 180-180.14 that remains of interest as the trader could essentially trade the range with a prior trend-side bias; and then if price does venture back up to resistance, manage the trade and look for breakout then.
EUR/JPY Four-Hour Chart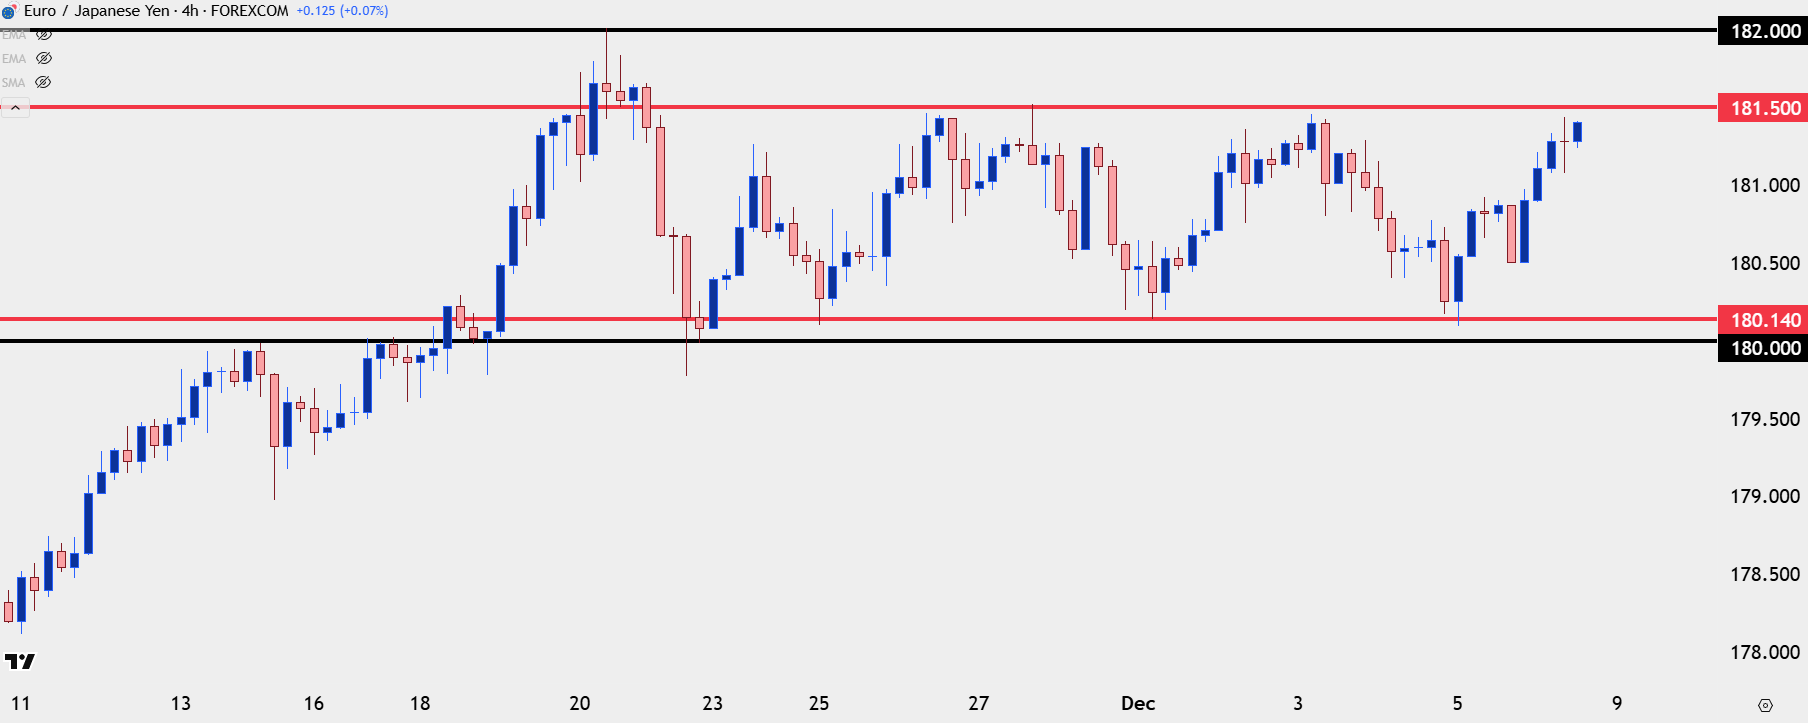
Chart prepared by James Stanley; data derived from Tradingview
GBP/JPY
For JPY-weakness I’ve been focusing on GBP/JPY for the past few weeks, following the GBP/USD recovery after the early-November sell-off. And as I wrote earlier, GBP/USD seems one of the more attractive major pairs for USD-weakness and if married up with USD/JPY which appears as one of the more attractive pairs for USD-strength, the trader can, in essence, remove the USD from the equation altogether by looking at GBP/JPY.
The complication with near-term GBP/JPY strategy is where the pair trades on a bigger picture basis. This is the same zone that reversed GBP/JPY back in the summer of last year – but this does offer some contrast to the EUR/JPY setup above, which is currently trading near ATHs.
GBP/JPY Weekly Chart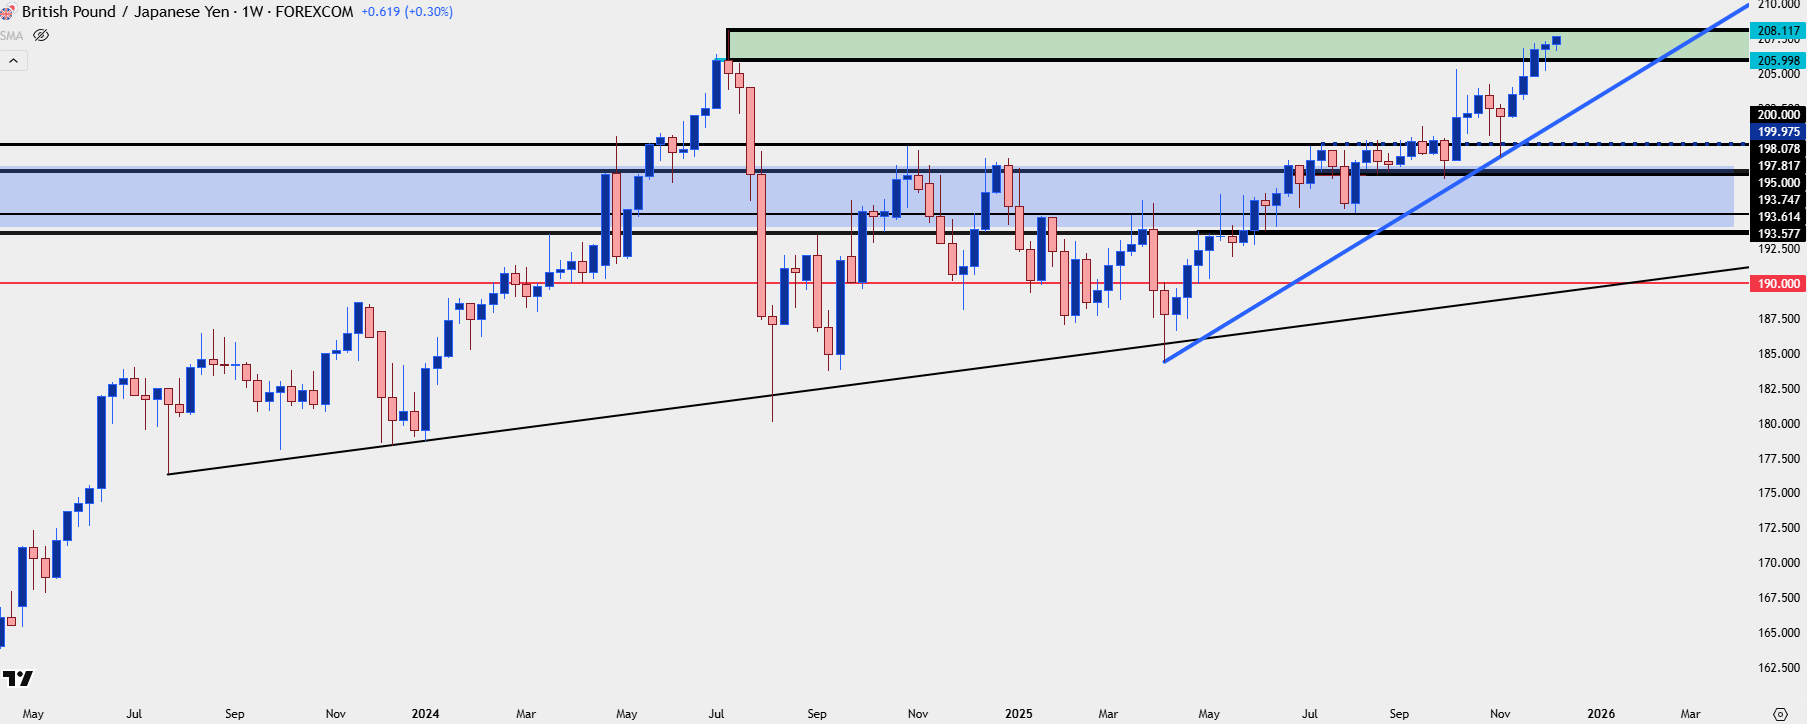
Chart prepared by James Stanley; data derived from Tradingview
GBP/JPY Shorter-Term
GBP/JPY is in the process of driving a short-term breakout and this is after the build of an ascending triangle formation in late-November and early-December trade. The next significant spot above current price is the top of that zone, which is the July 2024 high and the current 17-year high in the pair; so going back to what I said at the beginning of this section, it’s a difficult matter to chase.
Nonetheless, the ascending triangle formation along with the recent grind does offer some clarity for levels, with the 207.20 level as prior resistance and potential support, and the prior swing low of 206.60 as an ‘s2’ level below that. And if the pullback does thicken, then 206 is the ‘s3’ level that I would look to and if that gives way, it’ll look like a larger reversal is on hand, and that’ll be time to re-assess.
GBP/JPY Four-Hour Chart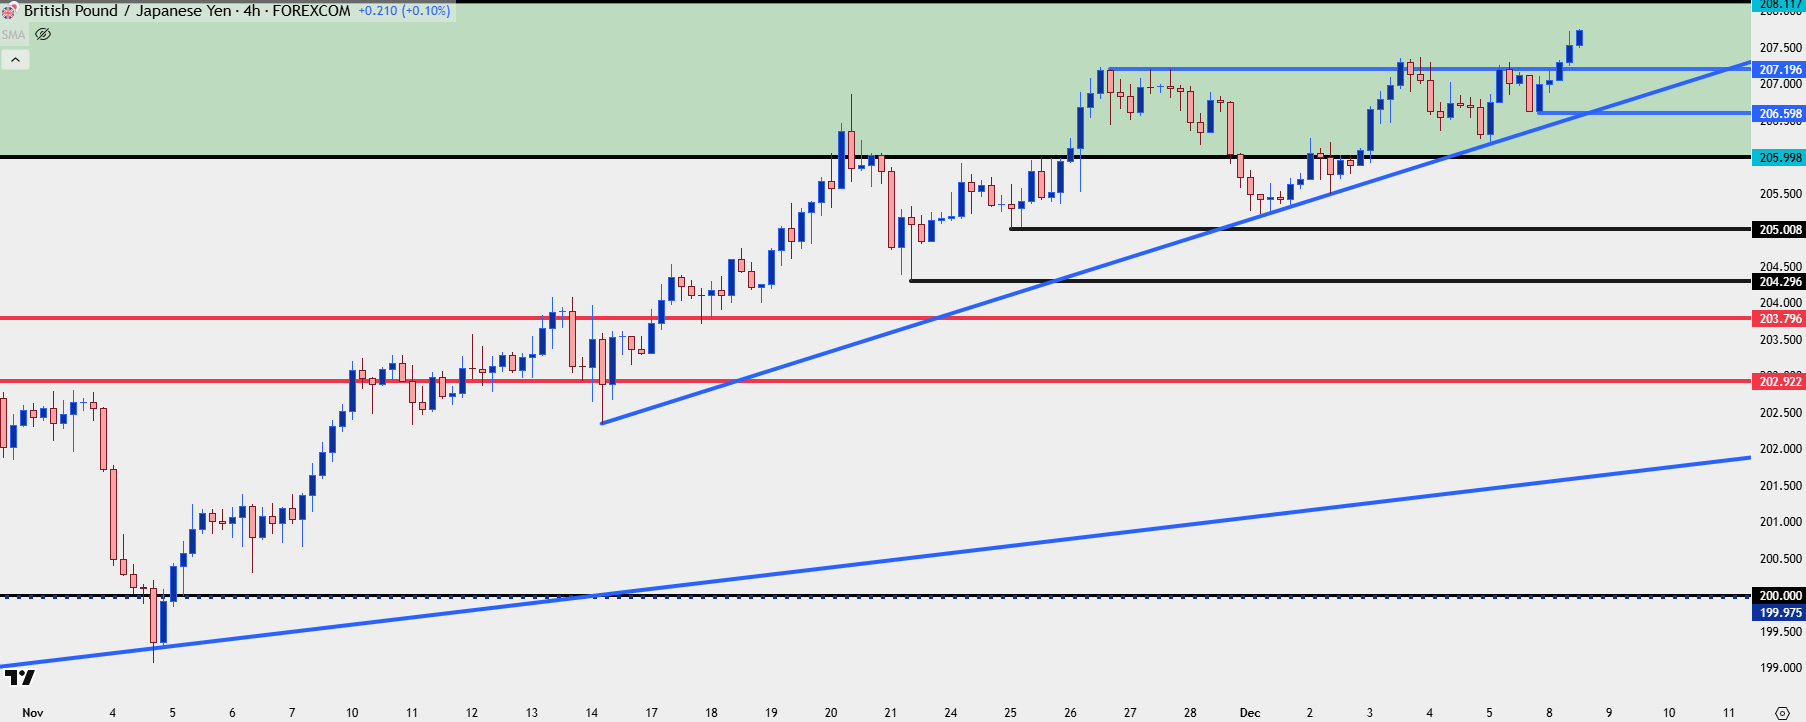
Chart prepared by James Stanley; data derived from Tradingview
--- written by James Stanley, Senior Market Analyst, Global Macro






