The announcement that Kevin Hassett is expected to be the next Fed Chair brought with it a bearish drive to the US Dollar. The current Director of the National Economic Council was named by US Treasury Secretary Scott Bessent as the likely next nominee to head the Central Bank a week earlier and that helped to rally equities and drive a sell-off in the Dollar, and that theme continued through this week as President Trump said that he already knew who he was going to name. When asked if it was Hassett, he didn’t verbally confirm but did seem to smile, and given Hassett’s history, this could be widely-inferred as a dovish push for the Federal Reserve.
Of course, the FOMC is not a dictatorship so the big question is whether Hassett will be able to push a dovish agenda and given where rates markets are currently, it seems that there’s at least some expectation that he’ll be successful. Right now, the bulk of expectation for next year is for the Fed to finish the year after another 50 or 75 bps in cuts in 2026 (assuming a cut next week, as well). And this stands in contrast to the Fed’s own Summary of Economic Projections from the September meeting that wasn’t quite so dovish.
Of course, the linchpin to this argument rests with inflation data and given the government shutdown were’ still operating with a bit of opacity; but provided that inflation doesn’t shock surprisingly to the upside, it would seem the Fed has an open door to push more softening into next year as we move towards mid-terms later in 2026.
In the US Dollar, the 98.98 level was in-play for most of the week after holding as support in the prior week. Given the calendar with the big event ahead for next week, this can be perceived as profit taking or squaring up ahead of the announcement; so there could possibly be qualification for a bullish argument. But the big test for that will be whether buyers can punch through lower-high resistance that’s formed on the four-hour chart, and I’m particularly drawn towards the prior zone from 99.33-99.56 for a test there.
US Dollar Four-Hour Chart
Chart prepared by James Stanley; data derived from Tradingview
USD Weekly
From the weekly chart, if we do see a close above 98.98 that could be qualified as defense and that would speak to the bullish argument. But, as I’ve been saying for months, I think the directional drive behind DXY will rest with the Euro and whether EUR/USD can punch through resistance.
There was similarly a test of higher-highs in the pair this week as USD tested lower-lows, but in each scenario trends failed to form and prices quickly pulled back.
As such, I want to continue focusing directional USD setups elsewhere, in GBP/USD for USD-weakness and USD/JPY for USD-strength, explained further below.
US Dollar Weekly Chart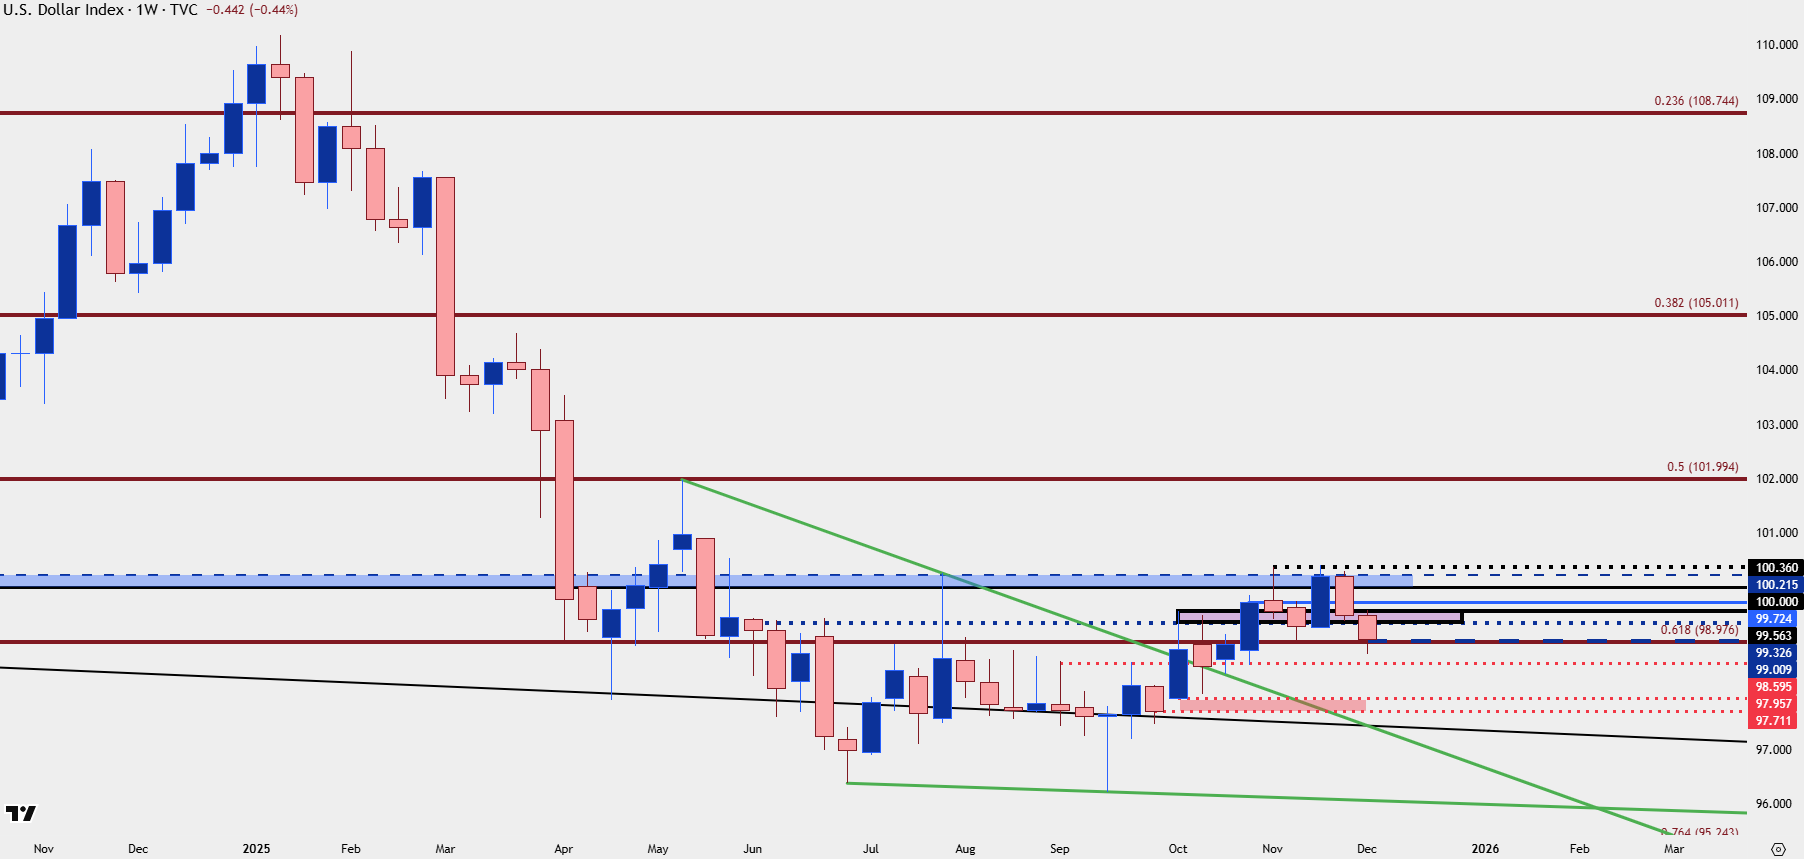
Chart prepared by James Stanley; data derived from Tradingview
EUR/USD
I’ve been saying that I think the key for USD trends rests with the Euro, and I remain of that mind. Bulls had an open door to make a run this week but so far have shown a similar form of trepidation as USD bears. That said, the door isn’t quite closed for EUR/USD bulls to make a run as there’s bullish structure on the four hour chart that remains in place given the higher-low at 1.1500 and the higher-high that just printed this week.

The 1.1593 level that was in play during the Tuesday webinar is now a big line in the sand for bullish EUR/USD themes on short-term charts.
EUR/USD Four-Hour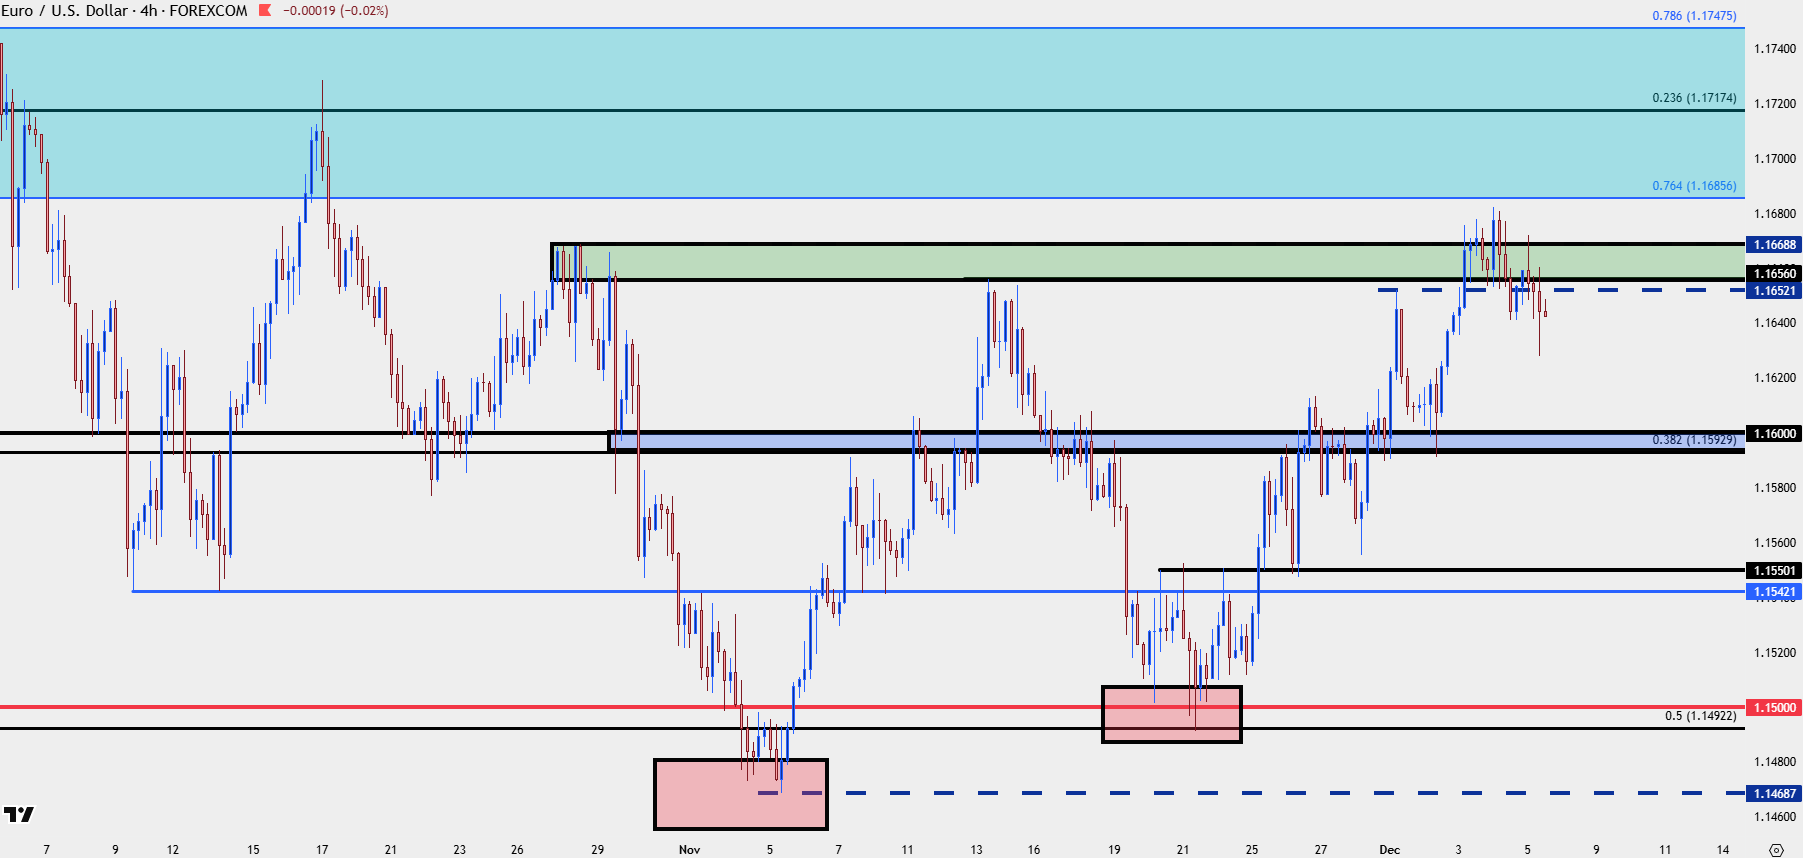
Chart prepared by James Stanley; data derived from Tradingview
GBP/USD
GBP/USD remains my favored market for USD-weakness. The pair has put in a more respectable string of higher-highs and higher-lows and that was front-and-center on Tuesday before USD had given up support at 98.98.
As the DXY sell-off stretched, the GBP/USD breakout ran up to a big zone of resistance around the 1.3350 level and that’s following a clean hold of support on Tuesday (also looked at in the webinar) at 1.3186.
For next week, I’m tracking supports at 1.3287 and 1.3250 with an ‘s3’ area at 1.3186, which is what bulls need to hold above to retain control. And for resistance, it’s the 1.3414 Fibonacci level followed by the 1.3500 handle.
GBP/USD Four-Hour Chart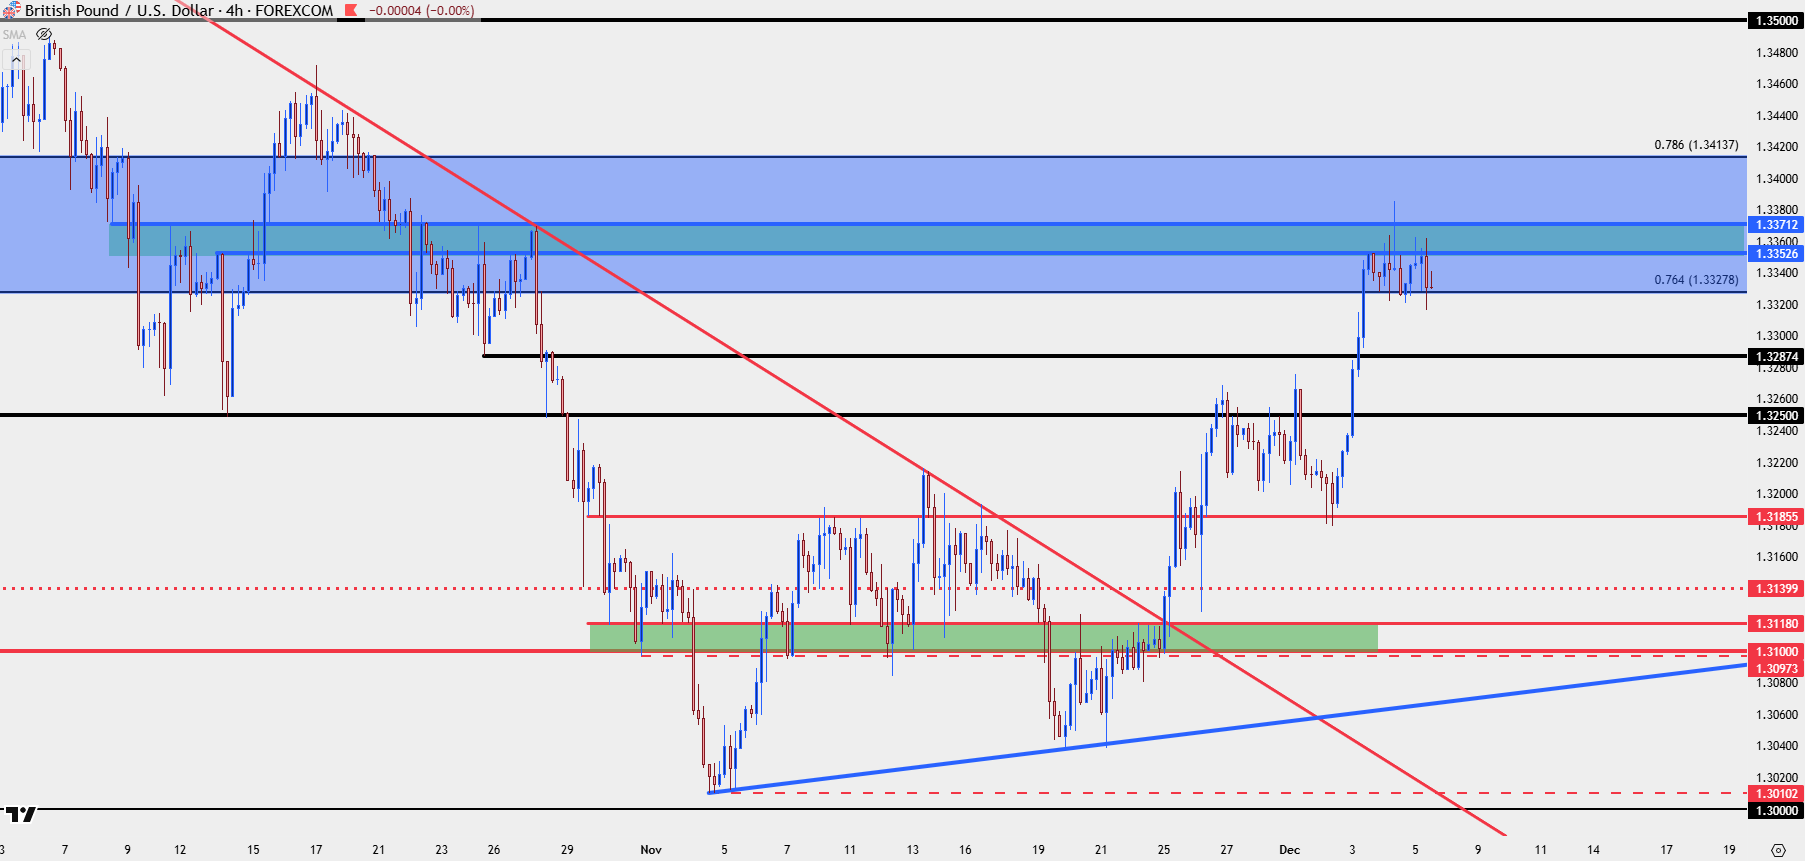
Chart prepared by James Stanley; data derived from Tradingview
USD/JPY
USD/JPY continued to pull back this week as markets price in a rate cut from the Bank of Japan later this month. I think the bigger concern, however, is whether the BoJ signals more hikes on the horizon and if they do, there’s very real risk of another carry unwind event. I think the normally conservative Kazuo Ueda would prefer to avoid that drama so I’m not anticipating him taking a heavy hand to forward guidance at the bank’s rate hike the week after the FOMC rate cut.

For now, perhaps more importantly, the same zone of support that I’ve been tracking at 154.45-155.00 has held, and there’s a short-term falling wedge that’s now in play. This can take on the appearance of a bull flag-like formation as the consistent bullish rally has put in a bit of pullback, and if looking to push USD-strength, I think this major pair remains one of the more attractive backdrops for such.
USD/JPY Four-Hour Chart
Chart prepared by James Stanley; data derived from Tradingview
--- written by James Stanley, Senior Market Analyst, Global Macro