


Japanese Yen Talking Points:
- USD/JPY has blasted off for a test above the 150.00 handle following the results of Japanese elections.
- Like I said last Thursday, be careful of reading too much into a short-term observation. In that case, many were getting bearish after a four-day slide in USD/JPY, but as I pointed out then, the range remained in-play and longer-term there was a bullish bias at work.
- EUR/JPY and GBP/JPY may be more compelling for JPY-continuation scenarios, and I’ll look at each in the webinar tomorrow. Click here to register.
USD/JPY is back above the 150.00 handle and the question now is whether bulls can press the breakout. There’s been several bull traps so far this year in USD/JPY and that illustrates the importance of caution, as both USD and USD/JPY bulls have been unable to press significantly above the 150.00 level since the fall back in April.
The test in late-July illustrates this well and it’s what happened after that remains of interest for USD/JPY bulls, as the pair then spent the next two months holding within a fairly consistent range. The support from that range was in-play last Thursday and that’s so far led to a strong rally, with another threat of breakout after the results of Japanese elections were priced-in after the weekly open.
USD/JPY Daily Price Chart
Chart prepared by James Stanley; data derived from Tradingview
USD/JPY Structure
Given the test of the 150.00 handle, this would be a difficult area to chase the move. But – there’s a few different ways that buyers could proceed ahead and as I outlined in the video, the most aggressive would be a show of shorter-term support at the 150.00 handle, illustrating some level of acceptance given the current test of a breakout there.
More reasonably, a few of the prior resistance levels and zones from the range come in as important. Nearby, there’s the 149.23-149.39 zone, with the 148.38 Fibonacci level below that. And that’s followed by the zone from 147.94-148.13. Range support is below that, at 146.95-147.14.
USD/JPY Four-Hour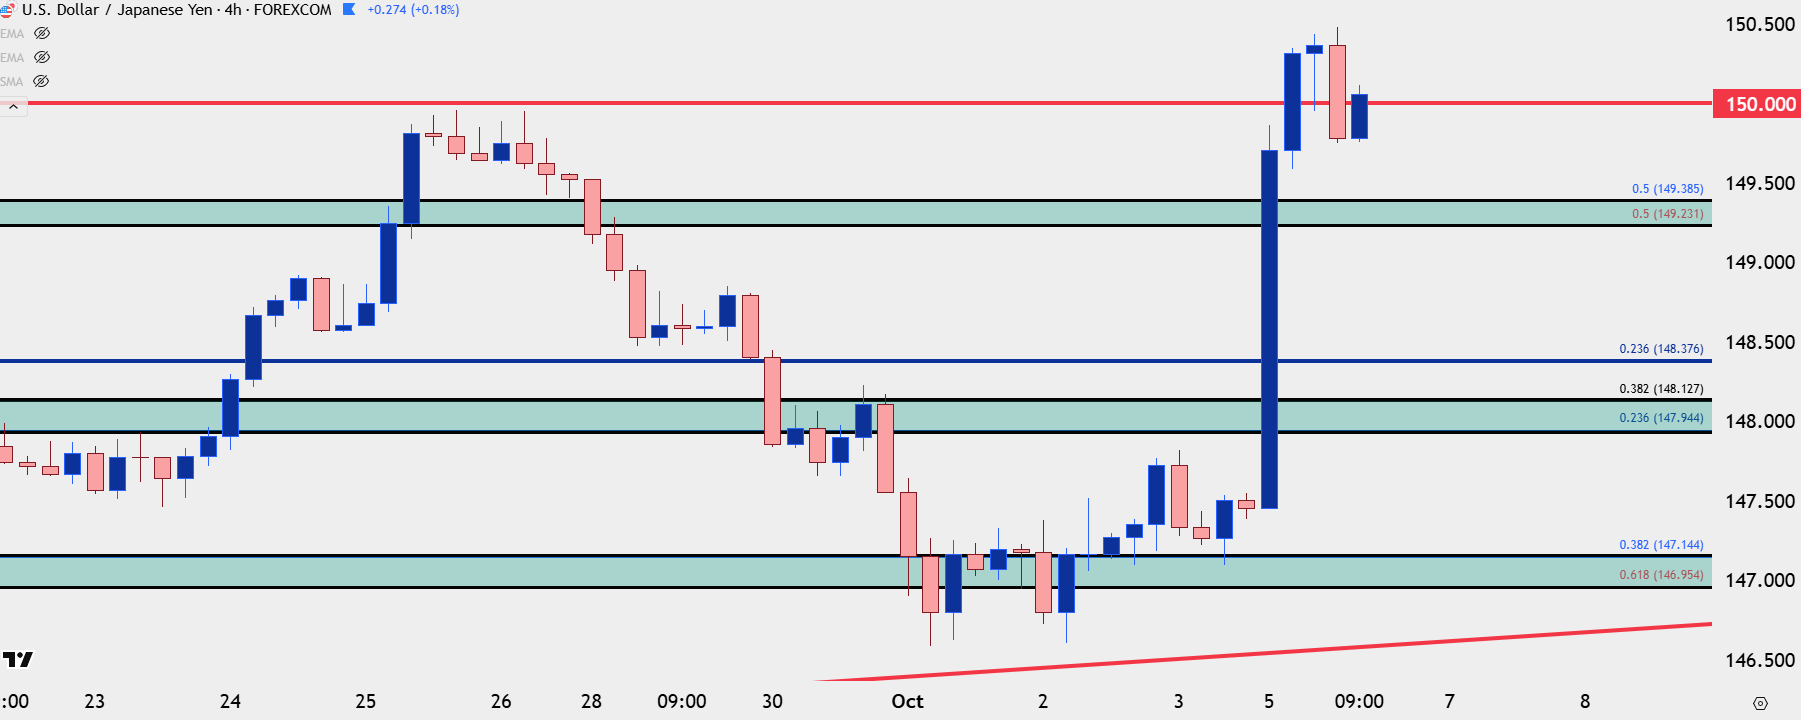
Chart prepared by James Stanley; data derived from Tradingview
EUR/JPY
EUR/JPY was testing support at a really big level last Thursday, and that daily bar ultimately closed as a doji formation. And then on Friday, a rally led to confirmation of a morning star formation, which is often approached with aim of bullish reversal, and so far this week, that’s precisely what’s shown.
The pair is now testing the 175.00 level that was previously problematic. There’s been just one daily close above that price for the pair, and it was last year, just before the 2,000+ pip reversal took over.
So far this week, there’s already been a show of support at that price. And now, a pullback with a higher-low above that swing could keep the door open for aggressive bullish strategies. If we do get a larger pullback, which given the prolonged nature of the trend, could be reasonable to expect, then the prior high of 173.90 looms large as this was resistance multiple times and hasn’t yet been tested as support.
EUR/JPY Four-Hour Chart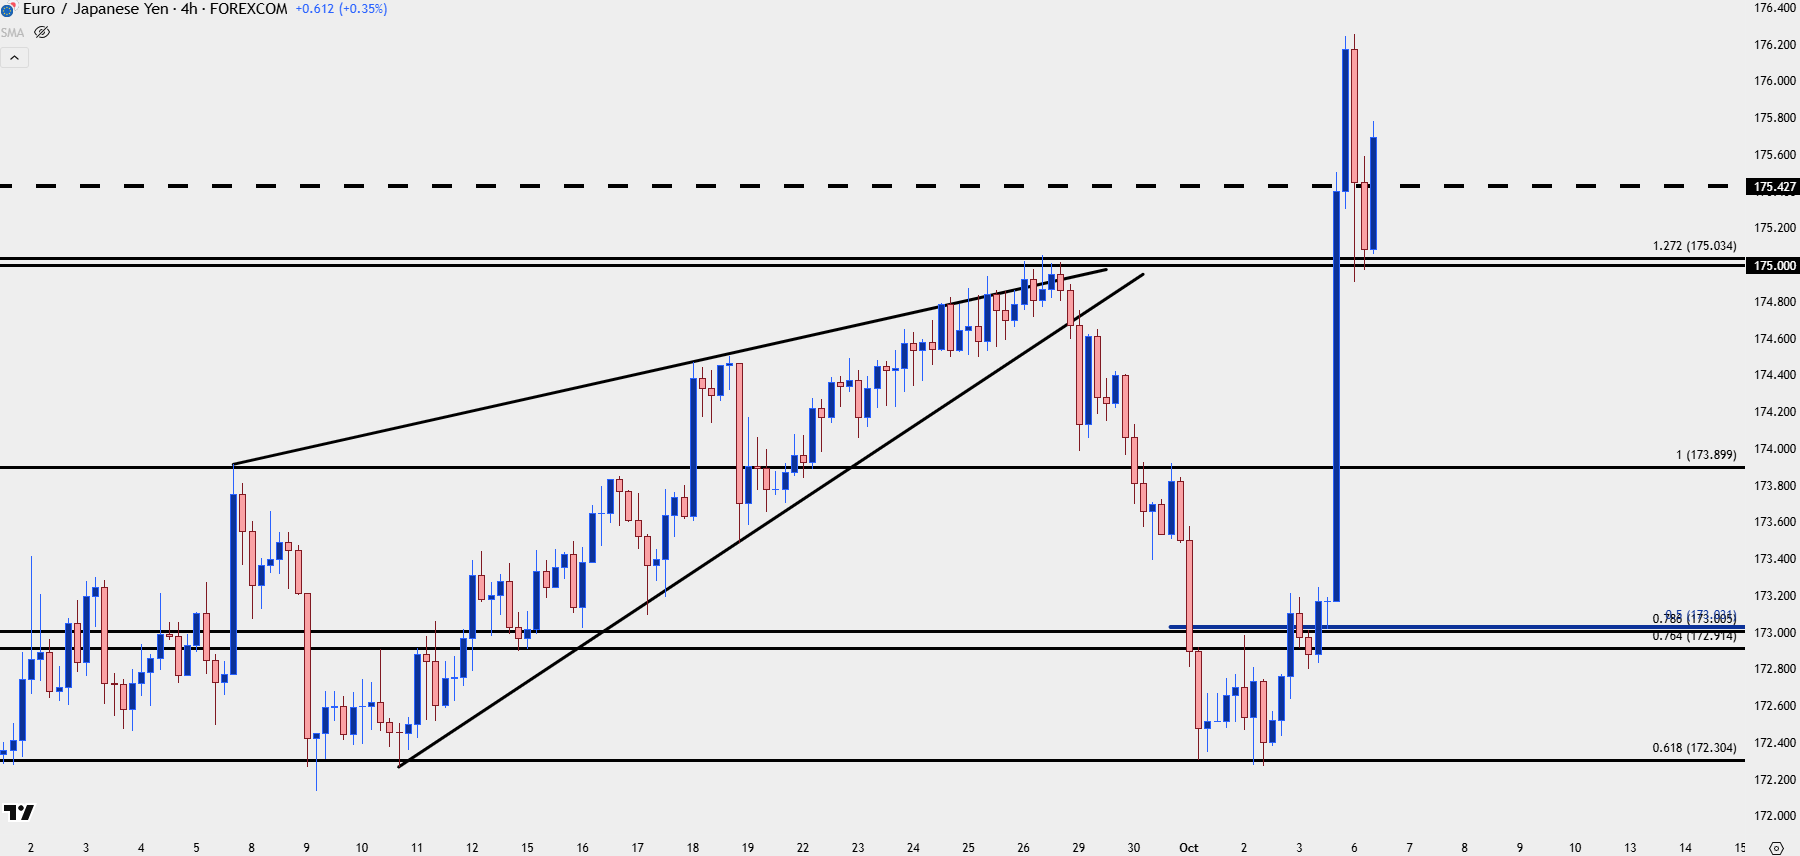
Chart prepared by James Stanley; data derived from Tradingview
GBP/JPY
The breakout in GBP/JPY is sizable and on a relative scope seems larger than EUR/JPY 1.49% so far today v/s 1.72%, as of this writing).
But perhaps more importantly it’s where that breakout is taking place. I’ve talked a lot about that 175.00 level in EUR/JPY and as noted above, there’s been just one daily close above that price. But, in GBP/JPY, it’s the 200 handle that’s in-play and the testing there has been going on since back in July. And today’s breakout is showing a greater degree of acceptance than what we’ve seen, thereby opening the door to continuation potential, particularly in JPY-weakness scenarios.
This presents a few different support levels above that 200-handle, which, ideally, will be supported as bullish anticipation holding over a 200-test would illustrate more attractive topside continuation potential.
There’s a Fibonacci level at 201.51 that’s now confluent with the 201.62 price swing, and that’s the closes zone. Below that, a prior price swing at 200.75 sits ahead of the 200.29 spot of prior resistance.
GBP/JPY Daily Chart
Chart prepared by James Stanley; data derived from Tradingview
--- written by James Stanley, Senior Strategist






