


Japanese Yen Talking Points:
- The Japanese Yen has shown a behavior change over the past week, after USD/JPY stalled just four pips shy of the 150.00 big figure.
- The more in EUR/JPY and GBP/JPY have been cleaner, as EUR/JPY stalled at 170 and then broke below the rising wedge formation, and GBP/JPY has seen four consistent days of selling so far this week, dropping by approximately 270 pips from last week’s close.
- The natural question here is whether a larger run of Yen-strength is afoot and key supports in each of the above pairs could highlight that potential
It’s been a strong start to Q4 for the Japanese Yen and that strength started even a couple days ahead of the Q3 close. Just a week ago, Yen-weakness was all the range and as I highlighted, caution should be exercised when chasing breakouts in USD/JPY, as several bull traps have shown so far in the pair this year.
Lo and behold, USD/JPY pushed up towards the 150.00 level and fell just four pips shy of testing the big figure on Thursday. And then on Friday, a mild pullback showed. But after this week’s open, Yen bulls and USD/JPY bears were very much on the attack and the pair has pushed right back down to range support. This has happened even as the decline in the US Dollar has been more moderate, illustrating the oncoming Yen-strength that’s shown so far over the past week, begging the question as to whether we’re on the cusp of a significant trend as Q4 trade gets underway.
USD/JPY Daily Chart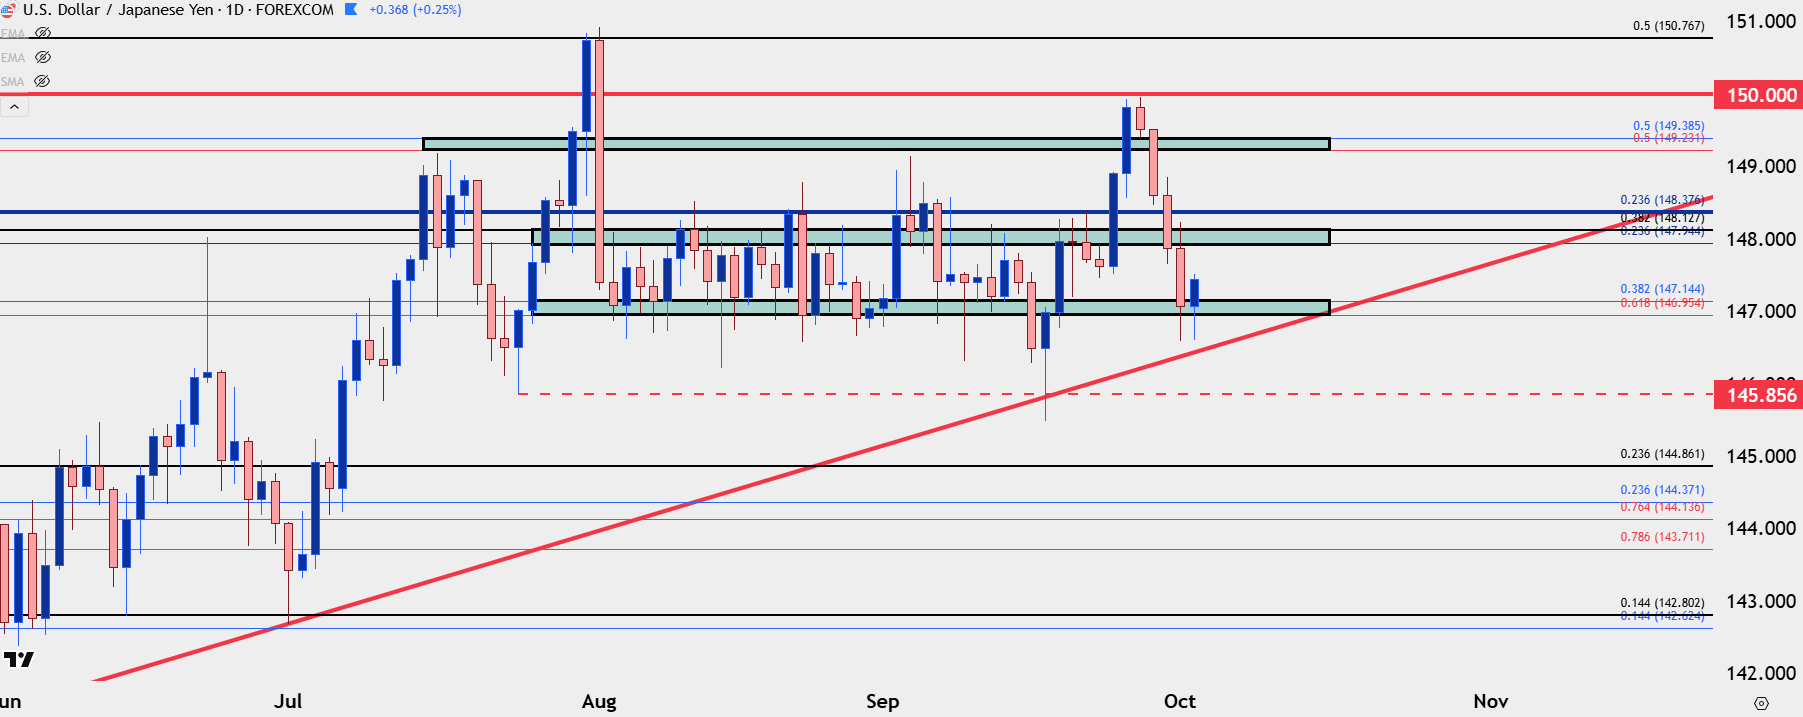
Chart prepared by James Stanley; data derived from Tradingview
EUR/JPY
The reversal has been perhaps a bit cleaner in EUR/JPY. I’ve talked about the 175.00 level there quite a bit as that’s been a rather dramatic price for the pair. There was one single daily close above that level last year – and that was the day before the start of the 2,000+ pip reversal, which was driven by both weaker US inflation and another round of intervention from the Bank of Japan.
More recently, bulls had started to show signs of stalling at that level but they were showing more and more willingness to test it when I updated on the pair last Wednesday.
But – as that stalling had started near the 175 level a rising wedge formation built – which is often approached with aim of bearish reversal. And that’s what’s played out so far this week with the pair dropping by more than 250 pips from that prior high.
EUR/JPY Four-Hour Price Chart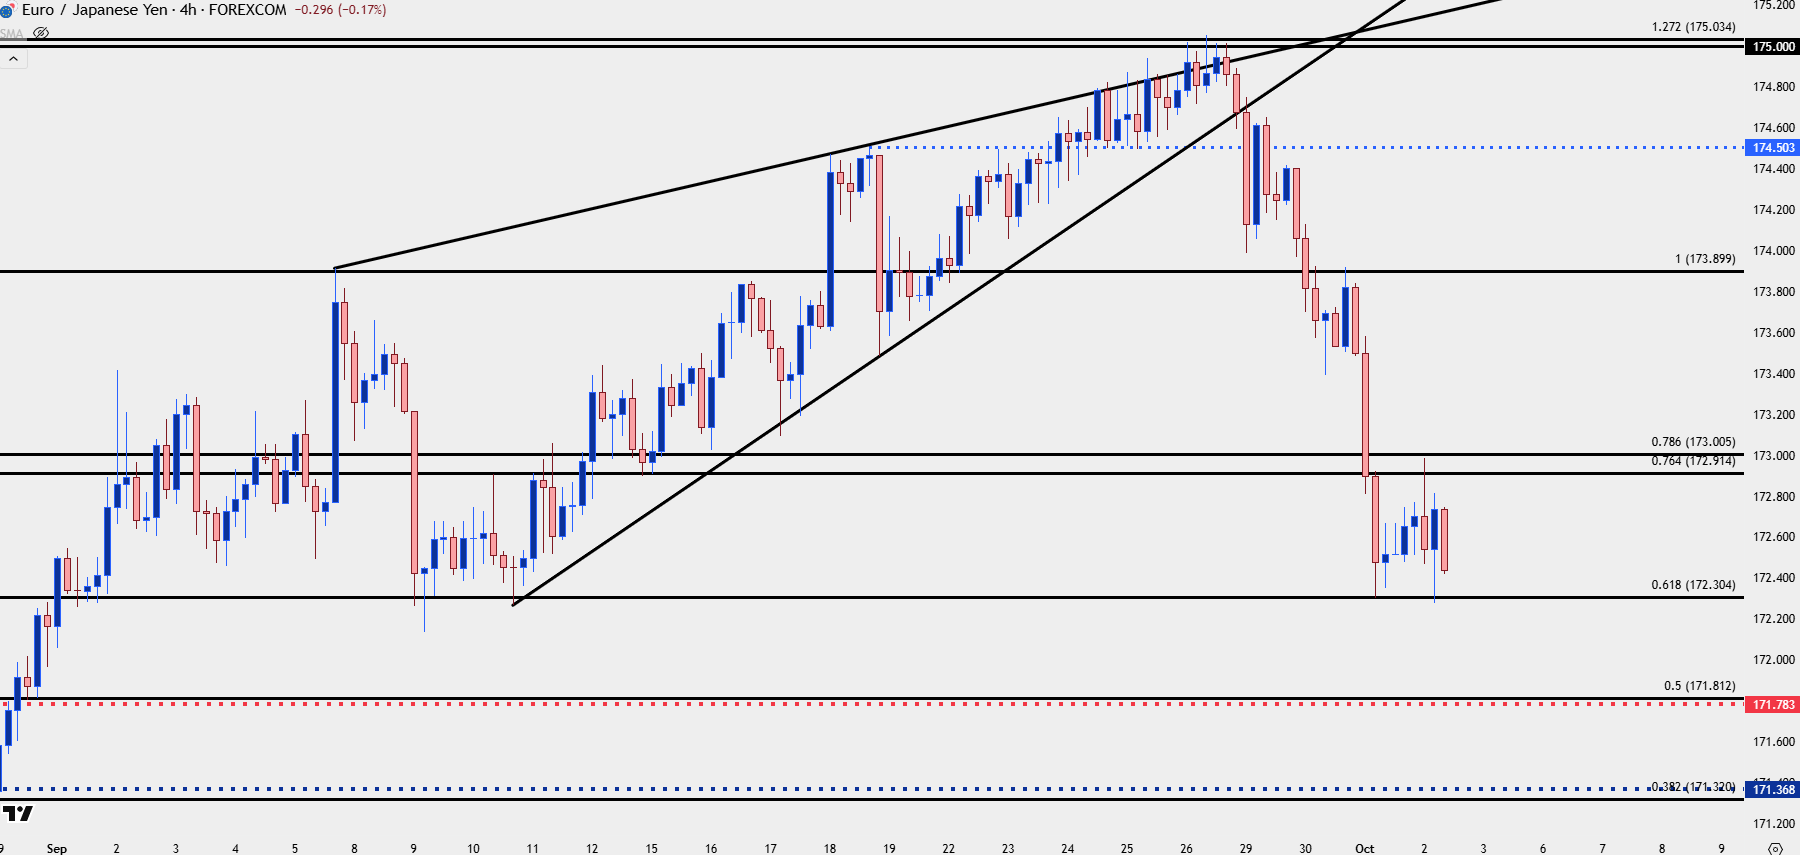
Chart prepared by James Stanley; data derived from Tradingview
EUR/JPY: The Support Test
Sellers have been in firm control so far this week and there’s now a support test taking place at a level that had held the lows in the first-half of September. This draws back to a Fibonacci retracement that set up in late-July, something that had impact through August and September trade. There was a steady build of support at the 38.2% retracement in the second-half of August, and then a show of resistance at the prior high of 173.90 in early-September. The pullback from that move held support at the 61.8% retracement – the same that is in-play right now after having set the low for yesterday. And even the rally from that support last month aligned with the Fibonacci setup – as the high printed right at the 127.2% extension of the July pullback move, just above the 175.00 handle.
EUR/JPY Daily Price Chart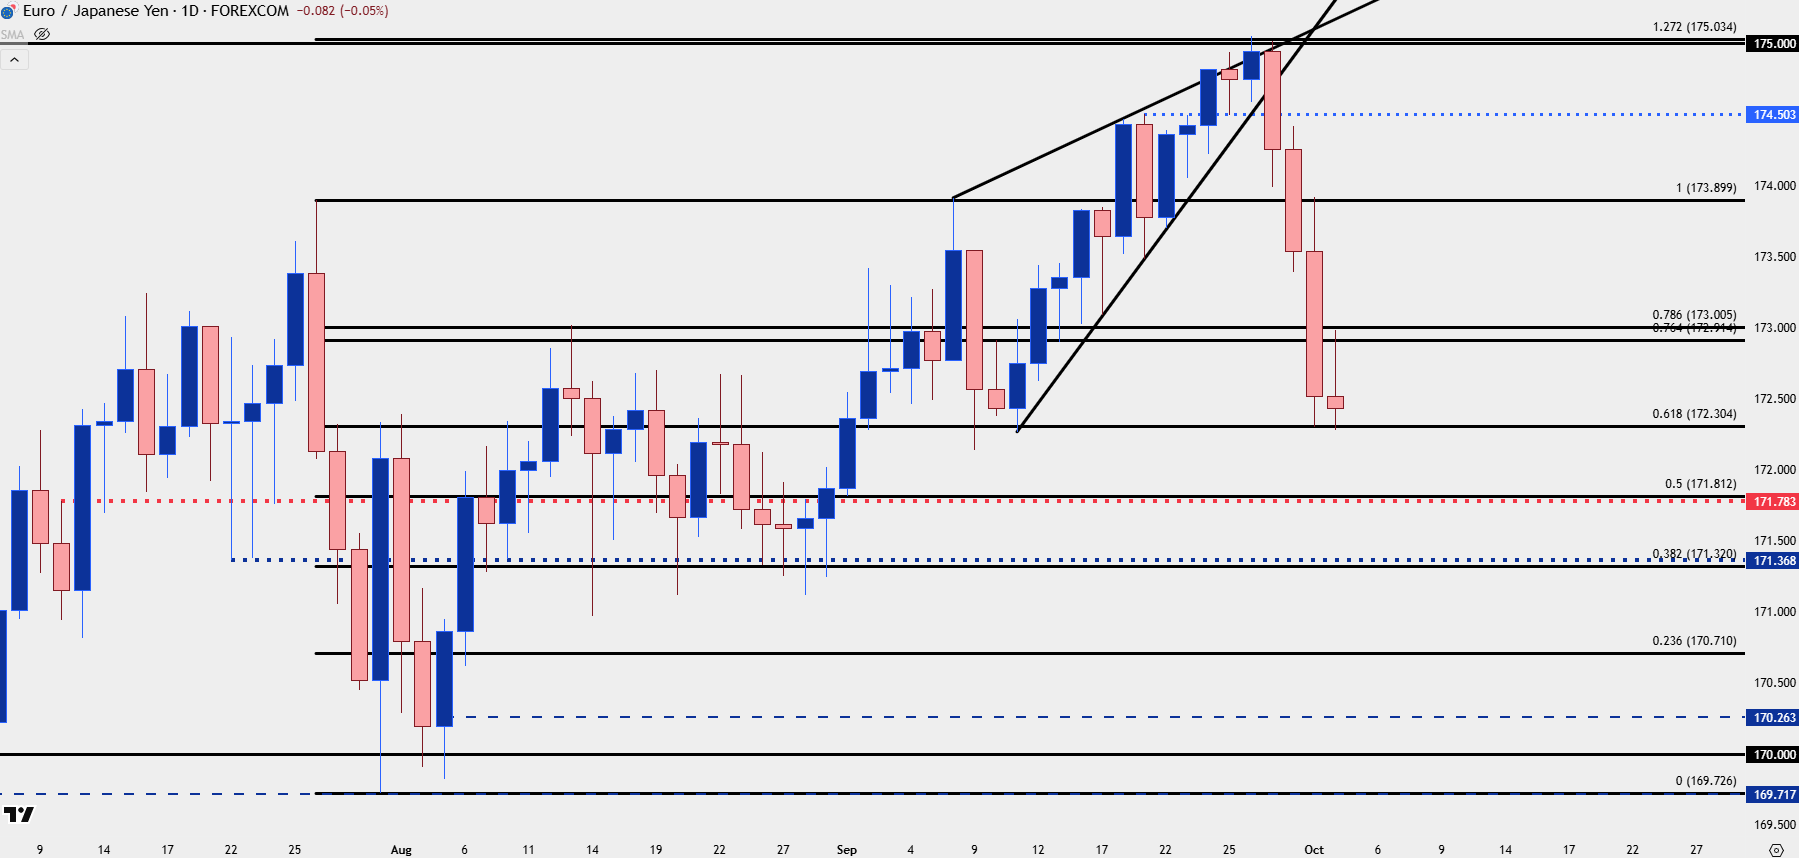
Chart prepared by James Stanley; data derived from Tradingview
GBP/JPY
While EUR/JPY can retain a case for bullish continuation and USD/JPY is holding range support which, in the longer-term backdrop of the pair can similarly be approached with a bullish bias, the picture in GBP/JPY is less optimistic on the long side after four intense days of selling.
The pair put in several tests of the 200.00 handle but ultimately was unable to remain above that price, and the pullback after the BoJ meeting last month has, so far, led into a pattern of lower-lows and highs that’s intensified this week. The pair is now nearing a area of confluent support potential, around the 197.50 psychological level which is nearby a Fibonacci level at 197.42. A test here would show a lower-low, and if we do see a bounce, that would open the door for shorter-term lower-high resistance potential at the 198.08 level, which is the top of the 2008 gap that’s continued to play a role in the pair’s price action.
GBP/JPY Daily Chart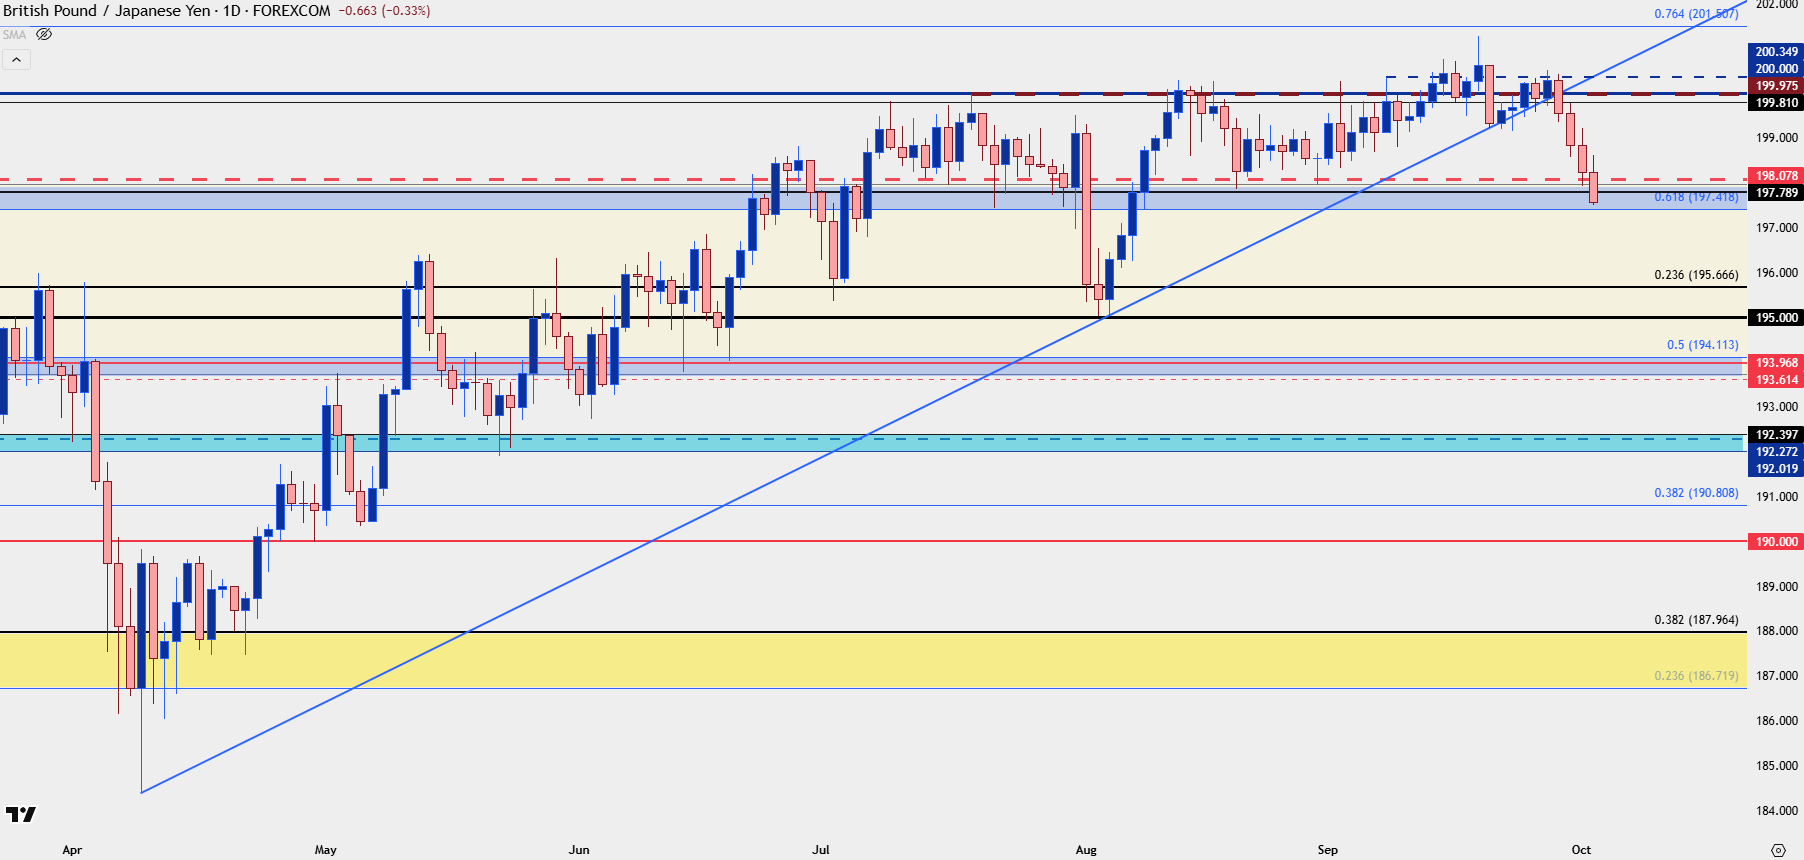
Chart prepared by James Stanley; data derived from Tradingview
USD/JPY: The Focus is on the US Labor Market
Going back to the major pair as this is the dominant market amongst the three discussed here, and the big question is just how aggressive FOMC rate hikes are going to come in as inflation remains elevated in the US. And this is a big part of the reason why USD/JPY hasn’t set fresh lows since the April test of 140.00, as both US equities and US data started to show in a more upbeat manner. Even with rate cuts remaining priced in for US markets, there was little fear for longs as USD/JPY held a July 1st higher low at 142.80 and then another higher low when the Fed actually announced the rate cut two weeks ago, around the 146.00 handle.
But as more signs show that the US labor market may be on the verge of unraveling, combined with both growing opacity around US data given the government shutdown (which, itself, will likely lead to some lost jobs) – going along with a persistent push around the BoJ that seems to eventually resolve with more rate hikes at some point down the road, and there could be a growing case for downside pressure in the pair.
This is all highly speculative, of course, because it was just a week ago that bulls were threatening a breakout after a test just below the 150.00 handle, and traders should be careful of reading too much into one single week of price action, especially when we’re talking about a pair that’s been largely range-bound for the past two months.
This is why the focus on USD/JPY is so important at current levels as a breach in that rhythm of higher-lows over the past five months on the weekly chart could accompany some other major moves in related markets, such as stocks. But, for now – the pair remains at range support and bulls have an open door to prod a test. If we see breach below 145.86 and then the 145.00 handle, particularly if it happens by the end of the week and remains on a weekly close basis, we can soon be looking at some different scenarios. And for those JPY-strength backdrops, I think GBP/JPY could be more attractive with what we have in front of us right now.
USD/JPY Weekly Price Chart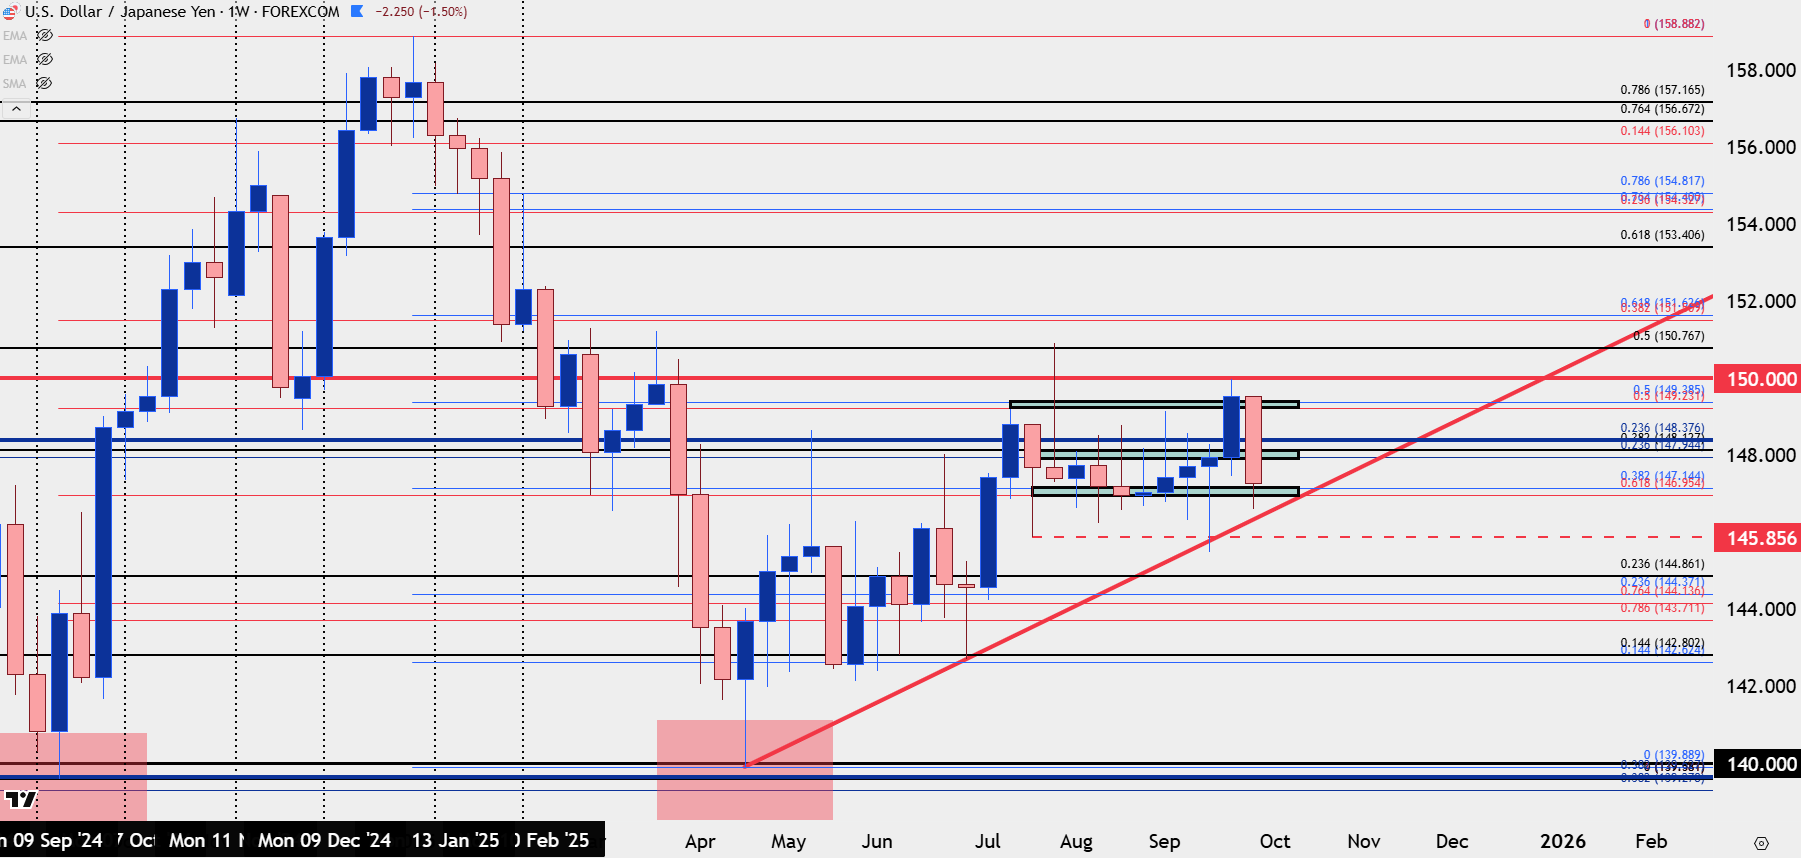
Chart prepared by James Stanley; data derived from Tradingview
--- written by James Stanley, Senior Strategist






