
Japanese Yen Talking Points:
- USD/JPY is testing a breakout as USD-strength remains after last week’s rate cut from the FOMC.
- Both USD and USD/JPY were strong after last year’s start of rate cuts from the Fed and that begs the question as to whether a repeat scenario is in store for this year.
- EUR/JPY is nearing the 175.00 level and that’s a major price in the pair as there’s been just one daily close above that price, and it was the day before last year’s 2,000 pip reversal took over.
- GBP/JPY is still vying for acceptance at the 200-level and it’s the daily chart that remains appealing there, as there’s been a support hold at a trendline projection.

USD/JPY has been a tricky pair to trade this year, especially for upside. There’s been several false breakouts or fast turns after fresh highs and the late-July example illustrates this well; although it’s certainly not the first.
I talked about that setup in an article on the matter, highlighting the difficulty in chasing USD/JPY breakouts, and less than 24 hours after that piece published the pair was more than 400 pips lower.
But – from that pullback came a range and that range has held for almost two months now. Like I looked at in yesterday’s webinar, there remains a bullish push here as USD/JPY has held higher-lows since the April inflection, even as the USD has continued to set fresh multi-year lows.
With USD stretching a bit more today, so too has USD/JPY. If we do see a similar scenario as last year, when the Dollar began to rally after the Fed started to cut, USD/JPY could finally be free to trend. Until then, there’s a couple key areas of resistance for bulls to contend with like the 149.23-149.39 zone, followed by the 150 level and then the 150.77 level that held the highs from that July breakout.
USD/JPY Daily Chart
Chart prepared by James Stanley; data derived from Tradingview
EUR/JPY
EUR/JPY has just one daily close above the 175.00 level and that was last year, on July 10th, which was then followed by a dizzying reversal as the pair shed more than 2,000 pips in less than a month. So perhaps it’s no surprise that as the pair re-approaches that level, bulls have gotten a bit more cautious and this is something that can even show relevance back in July.
At that point EUR/JPY had posed a clean break beyond the 170.00 level and made a fast push towards that 175.00 handle. But, once price got about 110 pips away, bulls suddenly lost interest, and price reversed. There was also the FOMC and BoJ meetings on the calendar later that week in July so it made sense that traders that had ridden the trend decided to square up ahead of the headline risk. At that point, the 170.00 level was in-play as support and this held after a strong pullback had appeared.
Bulls went back at it in August with a continued series of higher-lows and that even brought on another test of 173.90 later in the month, which again held the highs. Over the past week however bulls have gotten a bit more aggressive as they’ve finally forced a break over 173.90 and made a fast push towards the 175.00 handle.
At this point, that 173.90 level sits as higher-low support potential, an area of clean prior resistance.
EUR/JPY Daily Chart
Chart prepared by James Stanley; data derived from Tradingview
On a shorter-term basis, we can see that caution playing in again, as buyers have been slow to stretch upside while still defending supports. This is the type of price action that leads to the build of wedges, which are often approached with aim of reversal.
With that said, its not until there’s a downside break of wedge support that the formation comes to life and until then, there’s higher-high and low sequencing that bulls can operate with for continuation scenarios. And given how much digestion has shown above 175.00, a first re-test above the level can’t be ruled out for breakout potential, as longs that have been riding the trend have had ample opportunity to take profit, they’re just being offset by fresh buyers coming in to hold support at the lows.
EUR/JPY Four-Hour Price Chart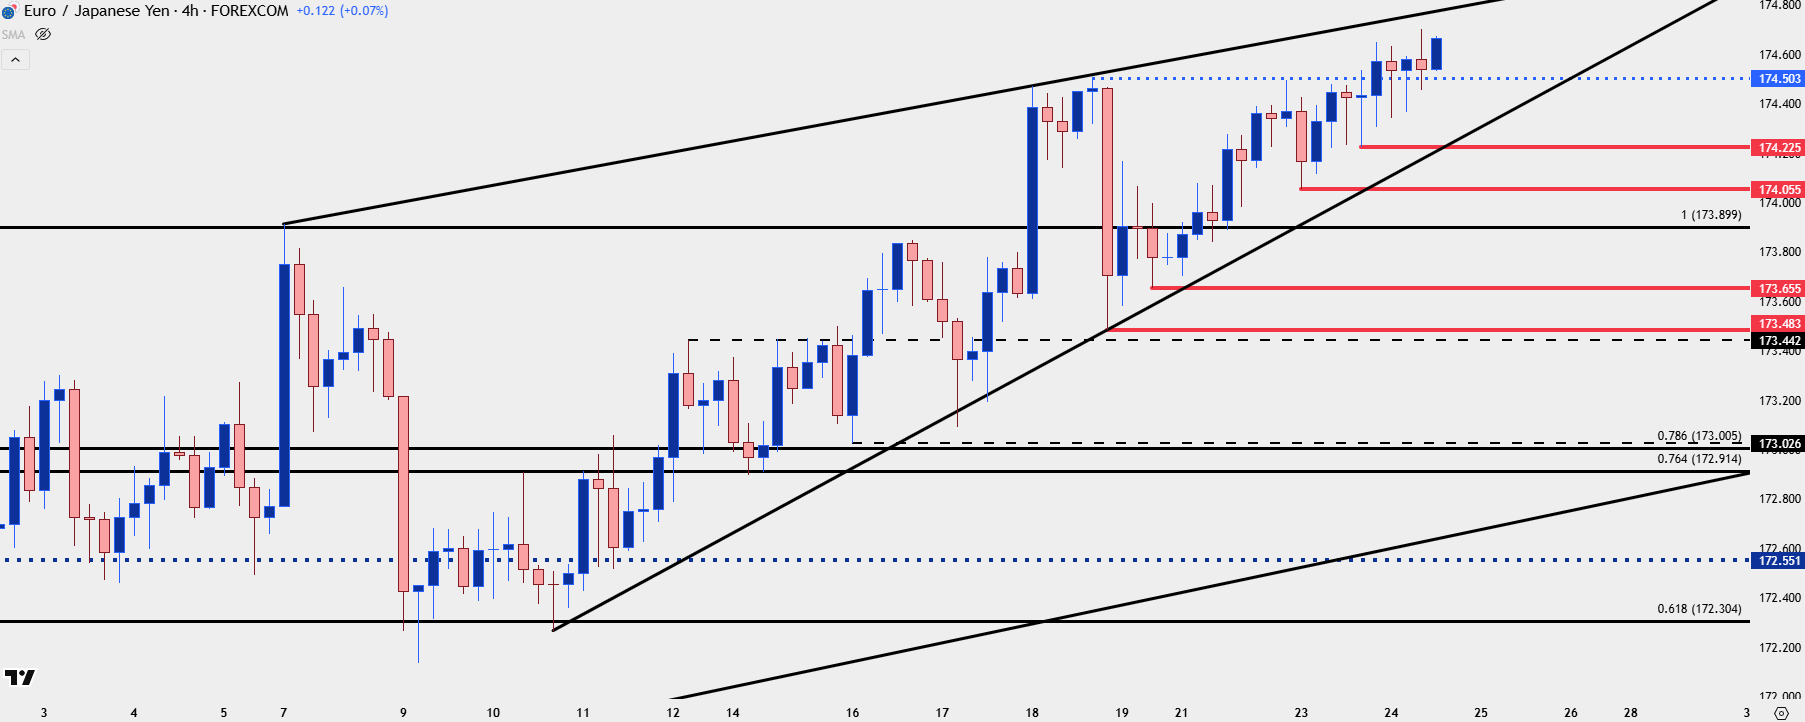
Chart prepared by James Stanley; data derived from Tradingview
GBP/JPY
While EUR/JPY illustrated the importance of psychological levels with the 175 resistance hit in July and the 170 support hit after, GBP/JPY is undergoing a similar test at a major psychological level of 200.
That price was almost in-play in July but bulls pulled up just 2.5 pips shy of the level, which led to a pullback of almost 500 pips. Buyers returned just above another major psychological level at 195.00, after which bulls were finally able to force a break above the 200-handle.
And while there has been evidence of increasing acceptance above that price, illustrated by the fresh high last week, bulls still haven’t shown ability to leave that price behind.
At this point, there’s been a hold at a trendline projection taken from April and August swing-lows, and bulls remain in order for continuation evidenced by the fact that price has pushed back above the big figure.
GBP/JPY Daily Price Chart
Chart prepared by James Stanley; data derived from Tradingview
--- written by James Stanley, Senior Strategist