
US Dollar Talking Points:
- It was a big week with multiple central bank meetings and while the dust hasn’t yet settled, the USD has put in a three-day rally after the Fed’s rate cut announcement.
- This resembles last year, to a degree, as the Dollar initially perched down to a fresh low and then rallied into the end of the press conference. This week was then followed by another two days of strength and the current weekly DXY bar is showing as a doji.
- Next week will be key for follow-through, in either direction, as there’s also been a jump in longer-term Treasury yields following the announcement which again resembles last year.
The Fed doesn’t control the entire US yield curve, and that was on full display this week as Treasury yields jumped even as the Fed cut rates. This is like what showed last year, as Fed rate cuts sparked a rally in stocks and a sell-off in bonds and in that instance, the moves ran into the end of the year. If investors are seeing higher inflation expectations on the back of short-term cuts, holding long bonds makes less sense, and that can help to explain the backdrop that’s shown in both instances as in each, the Fed cut rates even with inflation well-above their own 2% target.
The weekly chart illustrates this theme well, as sellers finally had an open door to go for a breakdown and so far, they’ve failed to run with it. Ever since the August NFP report, sellers have been responsive to fresh highs as denoted by the upper wicks on the below chart. But the underside wick on last week’s bar illustrates that failure to take control, and that’s something that could lead into pullback or possibly even reversal scenarios as we move deeper into the year.
Interestingly, the low from last Q3, when the Fed cut rates, is what’s set the high so far in the second-half of the year and that’s a major decision point for the USD which bulls will need to take out to illustrate greater control. And from last year’s instance, we can see that it took a few weeks for buyers to ultimately sway the trend, and they did so with force in Q4 even as the Fed was continuing to cut rates.
US Dollar Weekly Chart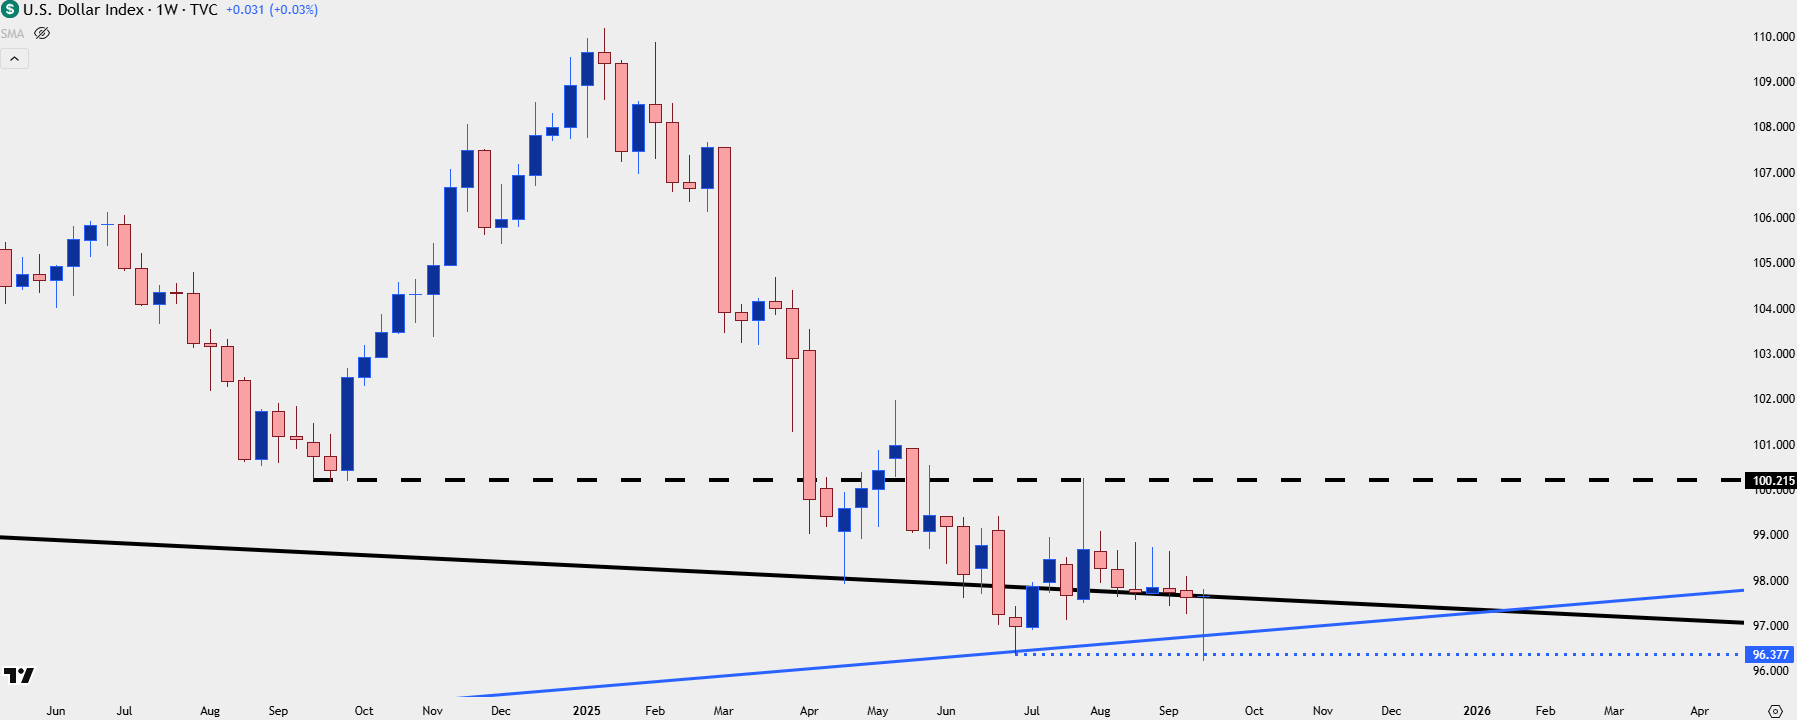
Chart prepared by James Stanley; data derived from Tradingview
EUR/USD
The DXY basket is 57.6% Euro so if we are going to see a reversal in the Dollar, it will probably need some help from the single currency.
Last week’s ECB meeting is when Christine Lagarde started sounding less-dovish, saying that the disinflationary process was over and that the Eurozone economy was in a good spot. That wasn’t quite match Powell’s tone this week when he classified the move as a ‘risk management rate cut’ to go along with a dovish forecast from the FOMC for the rest of this year and into next.
But – there does remain a possibly bullish backdrop in EUR/USD given the fact that price has held around some key supports so far. If this changes, that USD reversal potential can start to look more attractive next week but this is a really big deal for broader Dollar trends, again, very similar to what showed last year around the Fed’s first cut in September.
For support structure – the 1.1748 level is putting up a fight and below that, it’s the zone from 1.1675-1.1686 that stands out as important. If sellers can start to evoke daily closes below that area, the premise of a EUR/USD reversal will start to look more attractive and deductively, so too would reversals in USD/DXY.
EUR/USD Daily Chart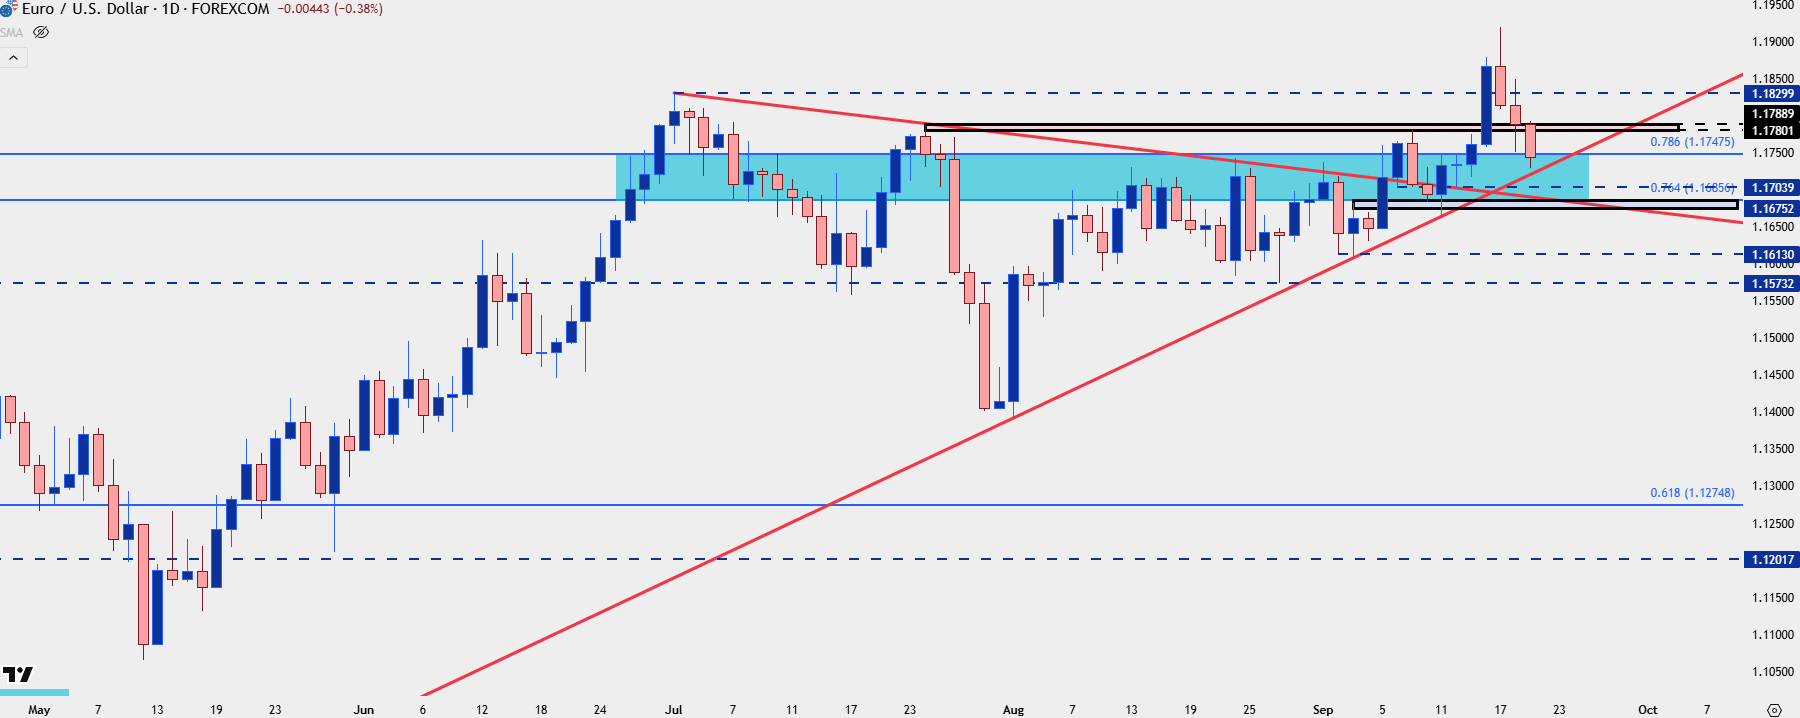
Chart prepared by James Stanley; data derived from Tradingview
The weekly chart of EUR/USD is also of interest, and similarly, this highlights failure from bulls to run with the fresh three-year-high. But, it also illustrates that important support structure that could potentially keep buyers in the equation, if it does hold.
Bears made a forceful move in July but since the August 1st NFP report, there’s been multiple episodes of failure from sellers as illustrated by those underside wicks on the weekly chart. With this week’s reversal, the question now is whether sellers can finally find follow-through.
EUR/USD Weekly Chart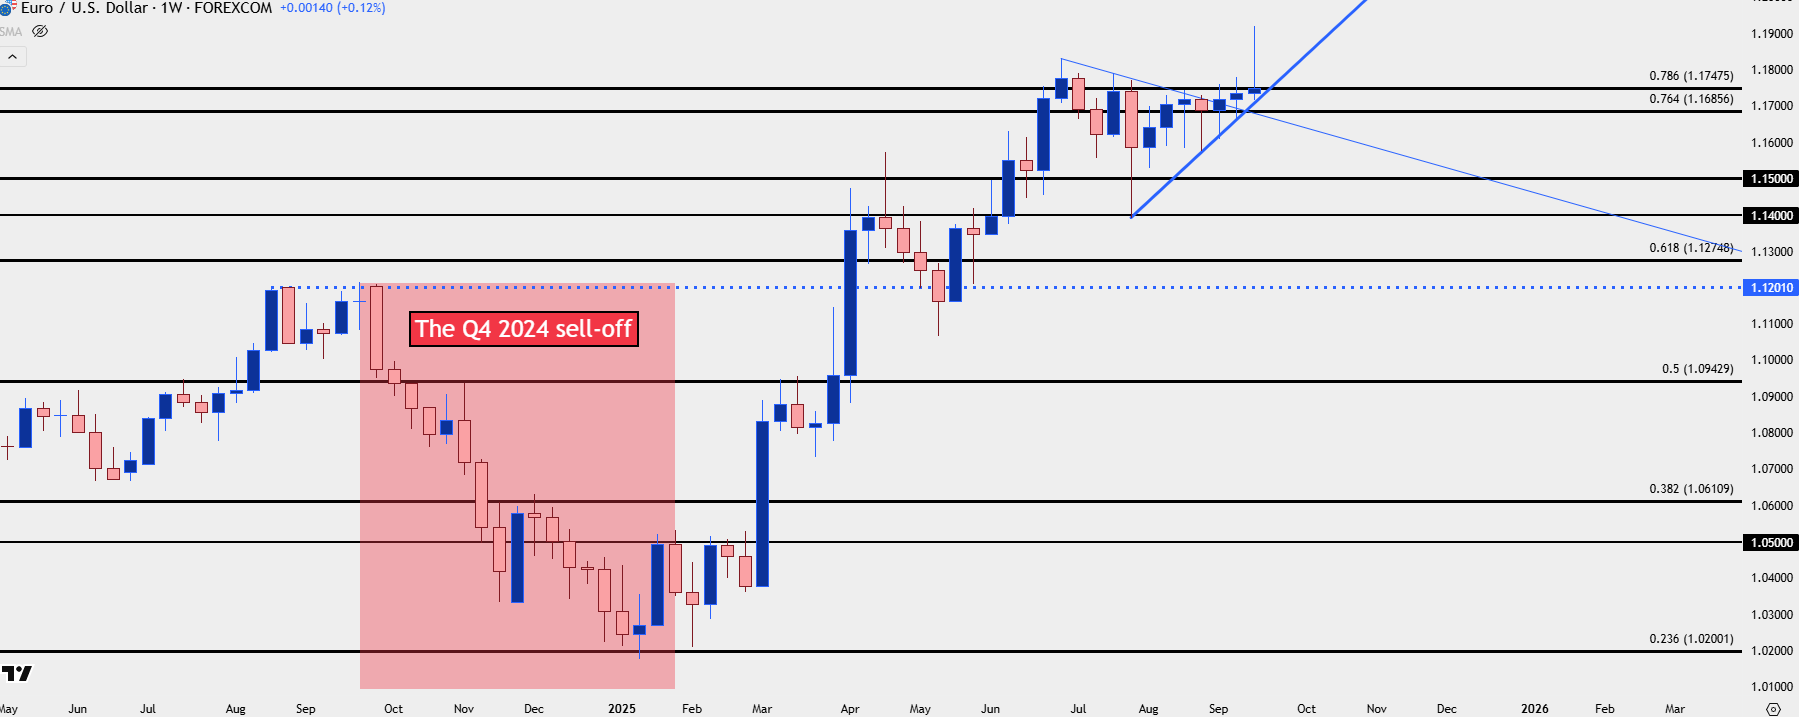
Chart prepared by James Stanley; data derived from Tradingview
GBP/USD
Initially Cable had a strong showing ahead of the FOMC meeting, with price venturing up for a re-test of the 1.3700 zone. But a reversal at FOMC followed-through with more sell-off on the BoE, and that has continued through Friday trade and now the weekly bar in the pair is showing as a bearish engulf with an extended upper wick.
Something like this puts bears in order and the question now is whether sellers can take out supports at 1.3414 and 1.3328. If so – we have a breach of a trendline that puts bears in order for further reversal potential.
GBP/USD Weekly Chart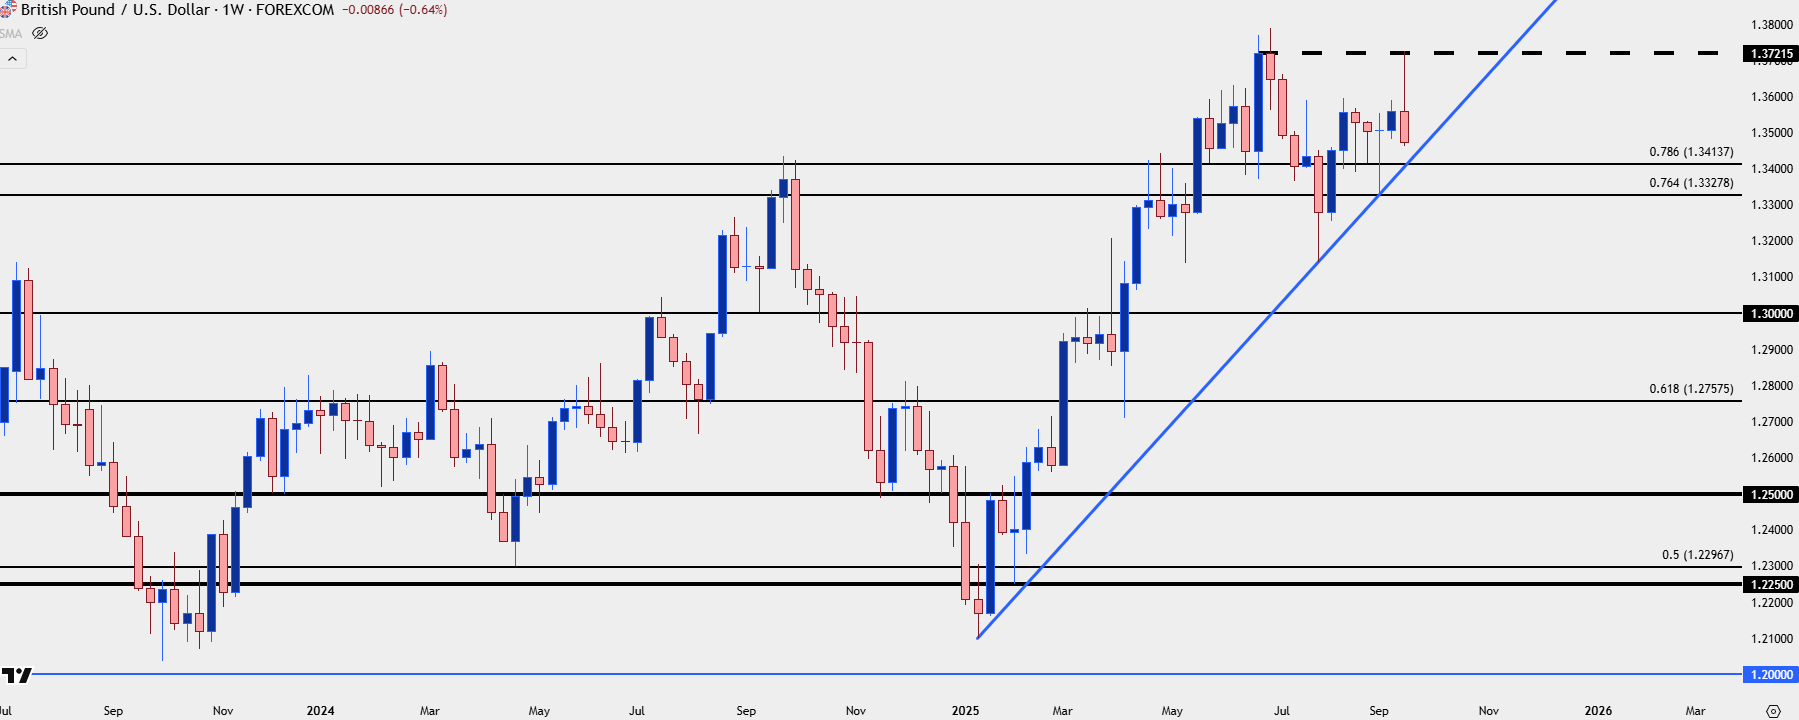
Chart prepared by James Stanley; data derived from Tradingview
USD/JPY
There are macro implications in USD/JPY and given the Bank of Japan meeting that saw a surge of Yen-strength against many currencies, that’s going to remain a big question as we move into next week and then Q4. The Bank of Japan announced that they were planning to pare their ETF holdings and there were actually two votes for a rate hike at last night’s meeting. BoJ Governor Ueda indicated that he sees gradual tightening if inflation stays on track and that’s a further pressure point for the matter, which helped to evoke that Yen-strength against both the Euro and British Pound.
But in the USD, that newfound Dollar strength likely kept a larger move of Yen-strength at bay. And then, of course, there’s bigger picture concern around whether the longer-term carry trade will see another show of unwind, similar to what showed last July.
It’s important not to draw too many final conclusions given how close we are to the drivers of FOMC and BoJ, and USD/JPY remains within the same range that’s been in place since early-August, which, again, illustrates reason not to prescribe too much to just a day of price action.
But – going back to last year we can see an important theme in USD/JPY that remains of interest today. USD/JPY began to sell-off on July 11th, just after the US CPI print made rate cuts from the Fed seem much more likely. Sellers dominated in the pair until eventually, a 140.00 test happened on the Monday before the Fed was expected to start cutting.
That 140.00 level held a bounce, and as we came into the Fed’s rate decision, it seemed vulnerable, as a dovish twist at the Fed to go along with a 50 bp cut threatened to up-end that bullish trend that had held so well for the prior three years-and-change. But – when the Fed cut, USD/JPY actually held a higher-low, above the 140.00 handle, and then started to show signs of rally.
And then as we came into Q4, with both USD and Treasury yields running higher, so too did USD/JPY. It didn’t take long but headlines were soon proclaiming ‘the return of the carry trade,’ which seemed disingenuous at the time given the Fed’s cutting cycle. But, it does illustrate how continued rate cuts from the Fed don’t have to be bearish for USD, or USD/JPY, and at this stage, USD/JPY remains well-elevated above that 140.00 level that held support again in April.
Given the rush of USD-strength, a breach of the 150-handle in USD/JPY opens the door for further upside in the pair.
USD/JPY Daily Price Chart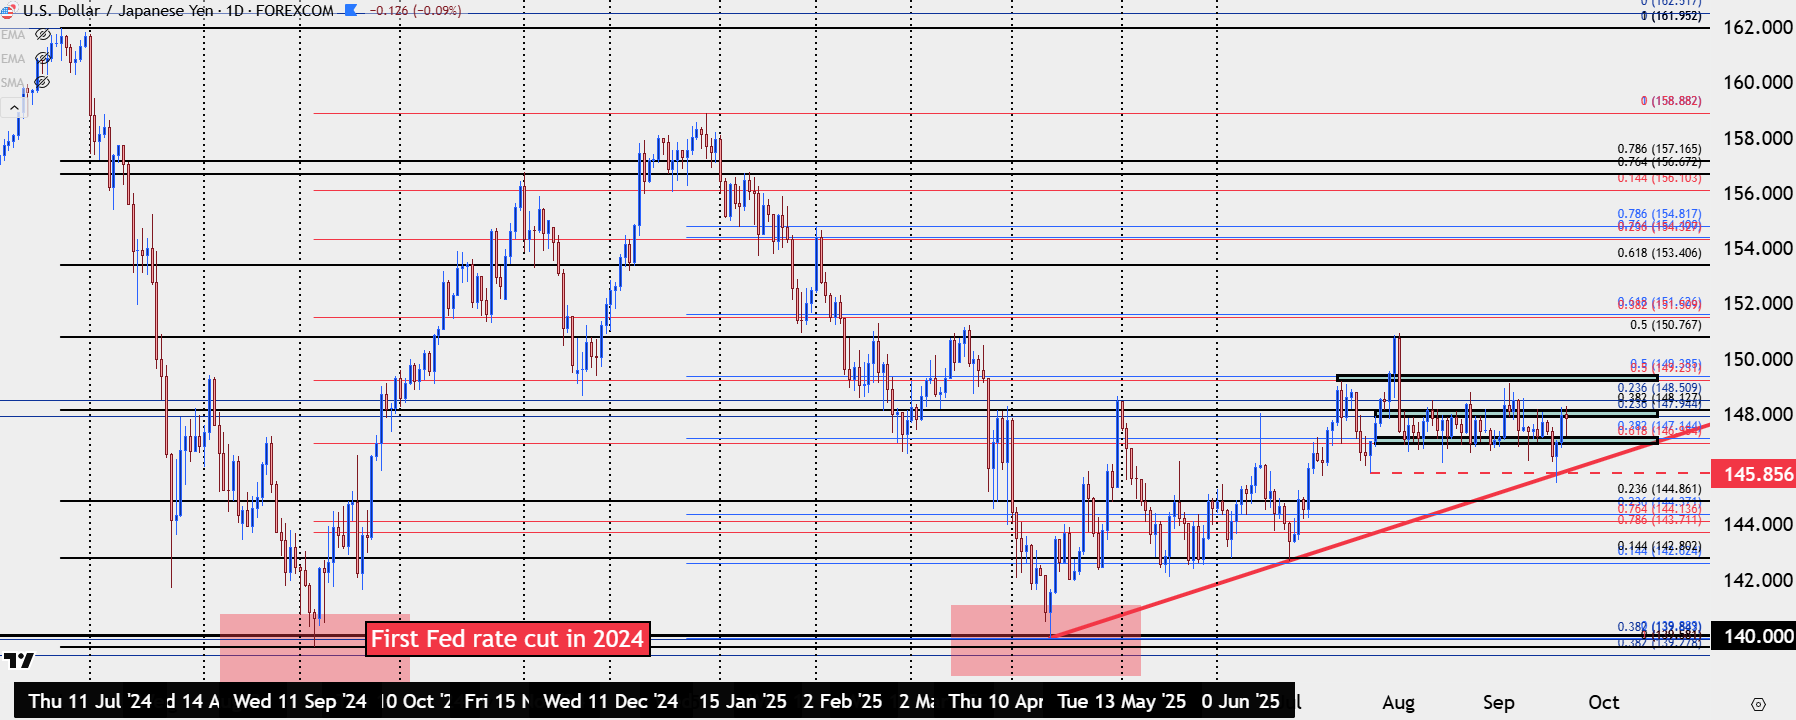
Chart prepared by James Stanley; data derived from Tradingview
USD/CAD
For USD-strength setups, I still like USD/CAD. But with that I must point out that the pair hasn’t kept pace with the three-day rally in DXY, as the Friday bar in USD/CAD currently remains in the red.
With that said, the attraction to the bigger picture setup here is the still-bullish structure that remain in-place, and that was illustrated again this week with a higher-low support hold at the same zone of prior resistance at 1.3750. I looked at that in-depth during the Tuesday webinar and that backdrop remains.
If we do see larger tendency towards USD reversal next week and into the Q4 open, other pairs could be come more attractive for Dollar-strength, such as the EUR/USD setup or the GBP/USD setup looked at above. But, from the weekly, both pairs still show potential for USD-weakness so, until that changes, USD/CAD stands out for USD-strength scenarios.
USD/CAD Daily Chart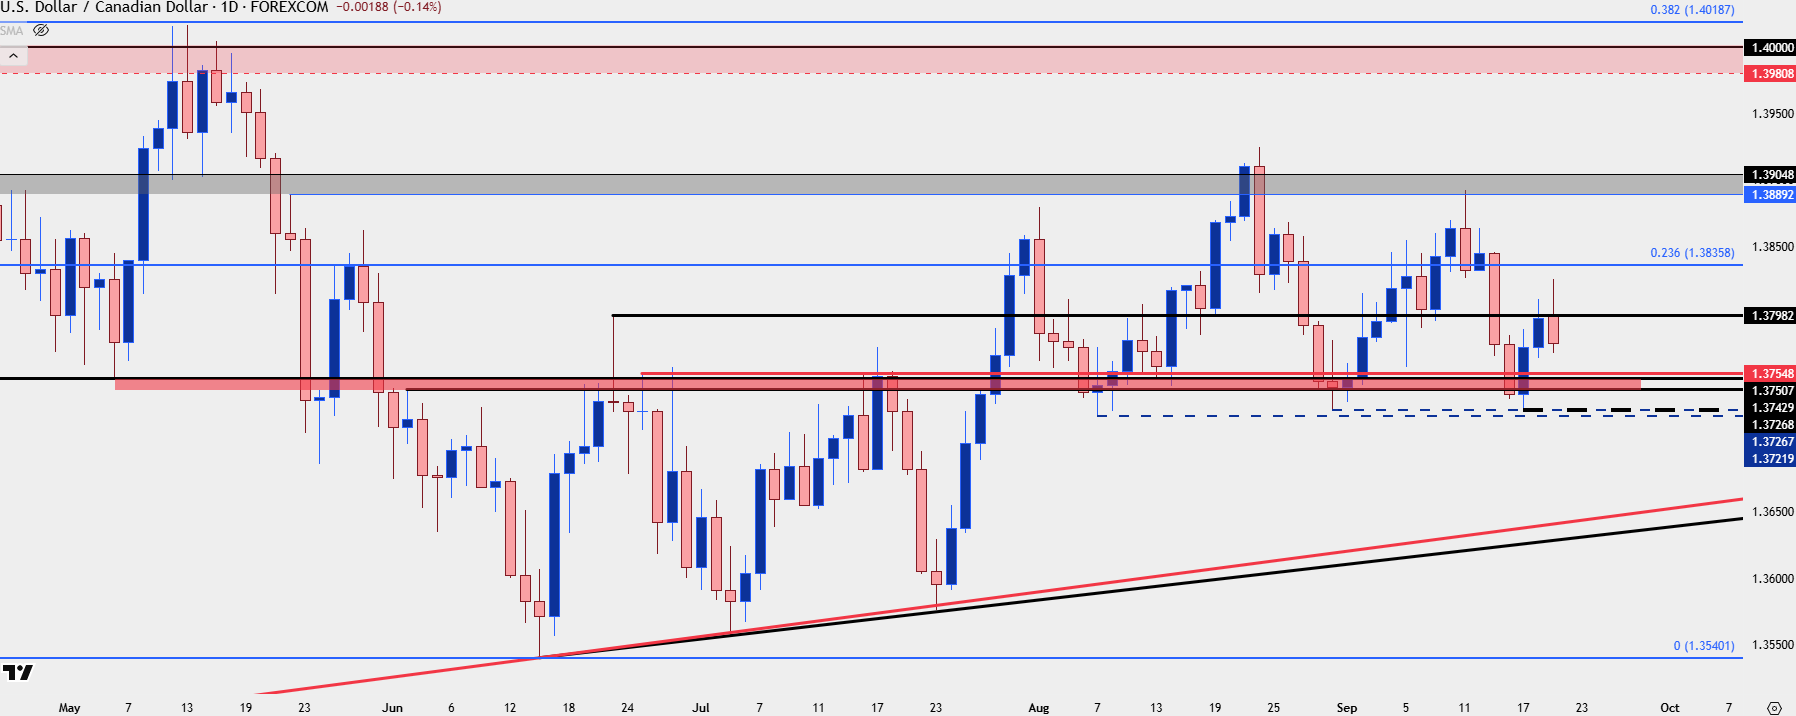
Chart prepared by James Stanley; data derived from Tradingview
--- written by James Stanley, Senior Strategist